Prerequisites
- An Azure account with an active subscription. If you don’t have one, create a free Azure account, which includes a free trial subscription.
- A Foundry project. If you don’t have one, create a project.
- An AI gateway configured in your Foundry resource. Foundry uses Azure API Management to register agents as APIs.
- An agent that you deploy and expose through a reachable endpoint. The endpoint can be either a public endpoint or an endpoint that’s reachable from the network where you deploy the Foundry resource.
This capability is available only in the Foundry (new) portal. Look for  in the portal banner to confirm you’re using Foundry (new).
Add a custom agent
You can register a custom agent in Foundry Control Plane. Develop the agent in the technology of your choice, for both platform and infrastructure solutions. When you register a custom agent, Foundry uses API Management to act as a proxy for communications to your agent, so it can control access and monitor activity. The following diagram shows the resulting architecture when you register a custom agent.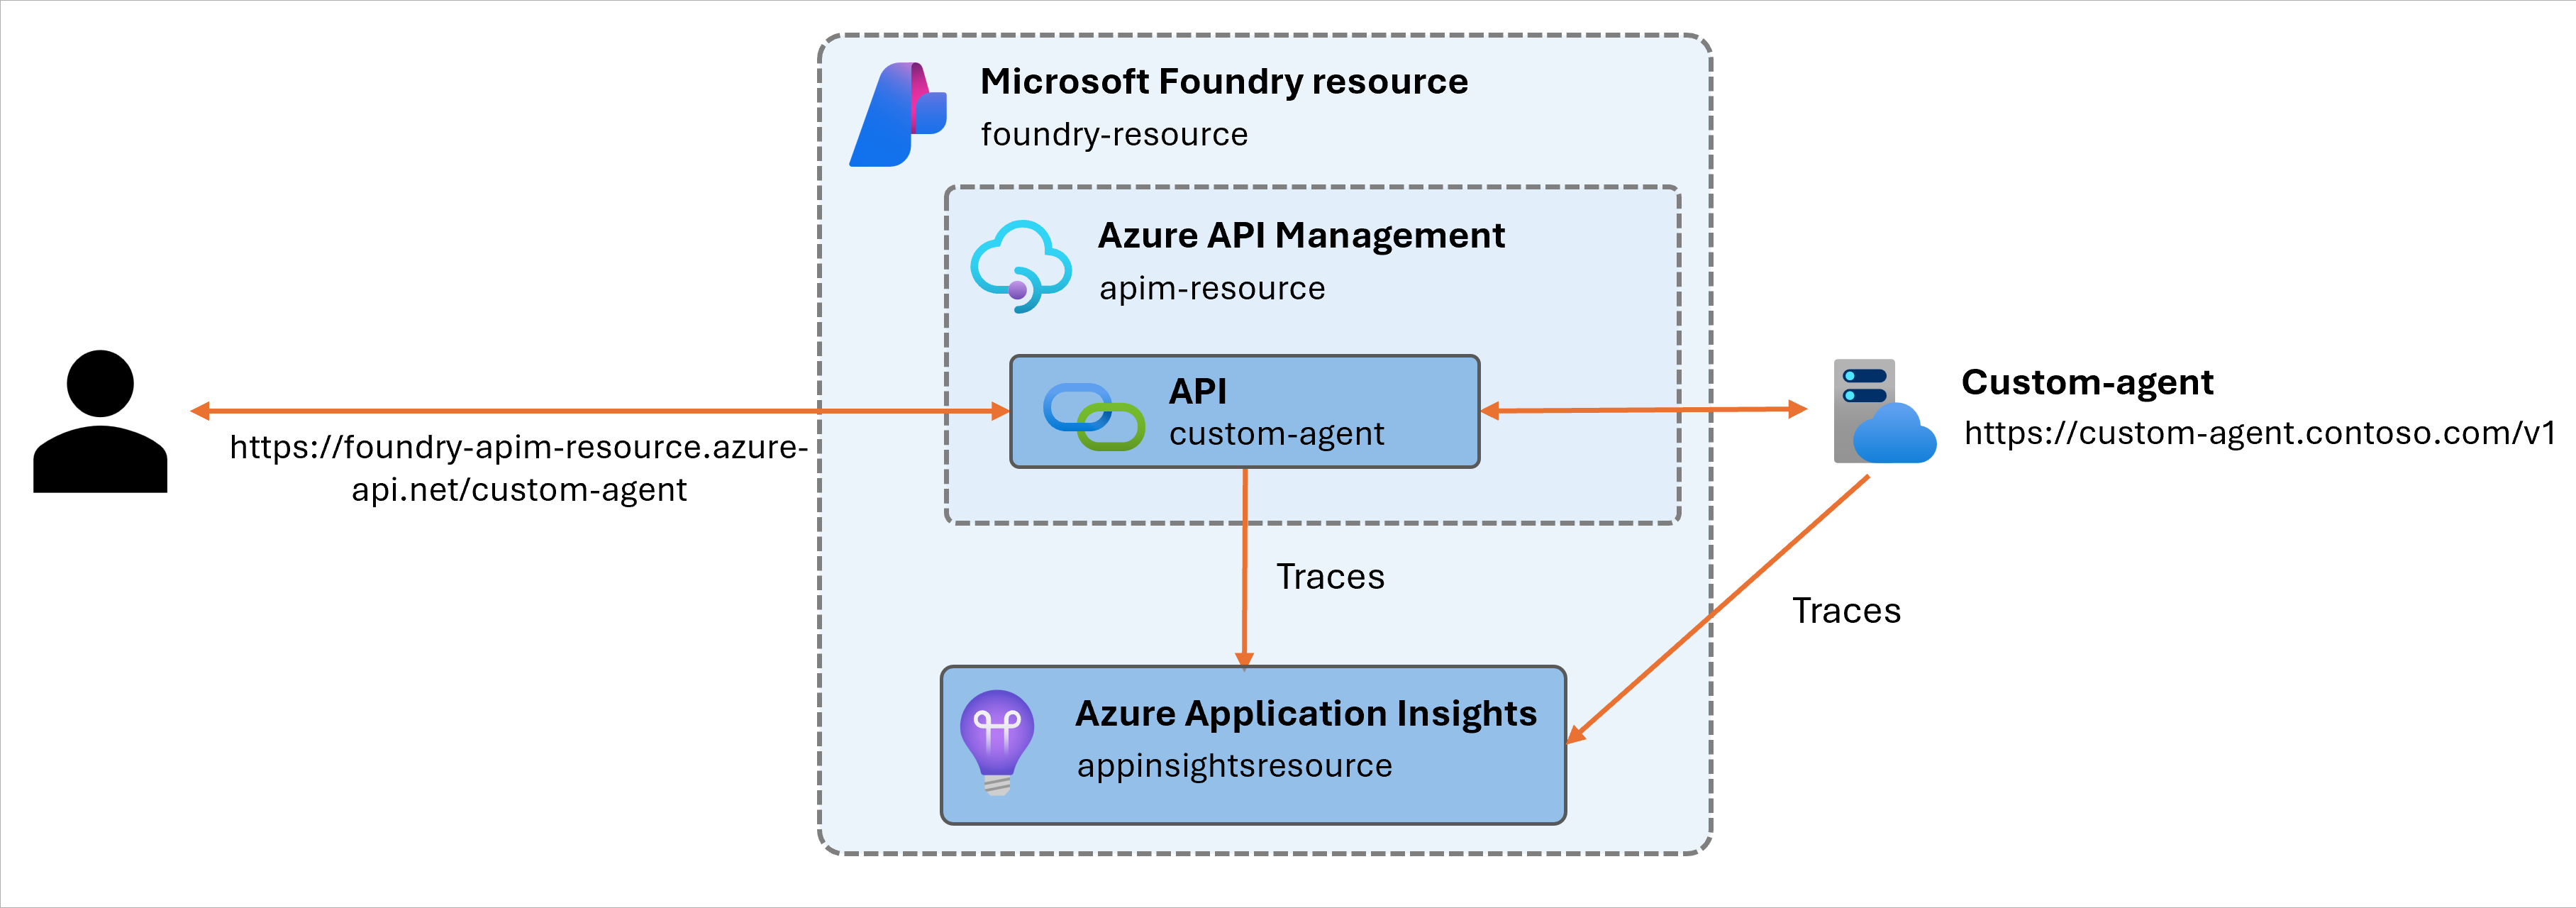
Verify your agent
Verify that your agent meets the requirements for registration:- Your agent exposes an exclusive endpoint.
- The network where you deploy the Foundry resource can reach the agent’s endpoint.
- The agent communicates by using one of the supported protocols: HTTP (general) or A2A (more specific).
- Your agent emits data by using the OpenTelemetry semantic conventions for generative AI solutions (or you don’t need this capability).
- You can configure the endpoint that users use to communicate with the agent. After you register an agent, Foundry Control Plane generates a new URL. Clients and users must use this URL to communicate with the agent.
Prepare your Foundry project
Before you register the custom agent that you added to a Foundry project, make sure that you configured the project correctly:- Sign in to Microsoft Foundry. Make sure the New Foundry toggle is on. These steps refer to Foundry (new).
-
Ensure that an AI gateway is configured in your project:
- On the toolbar, select Operate.
- On the left pane, select Admin.
- Open the AI Gateway tab.
- The pane lists all the AI gateways configured and mapped to a Foundry resource. Check if the Foundry resource that you want to use has an associated AI gateway.
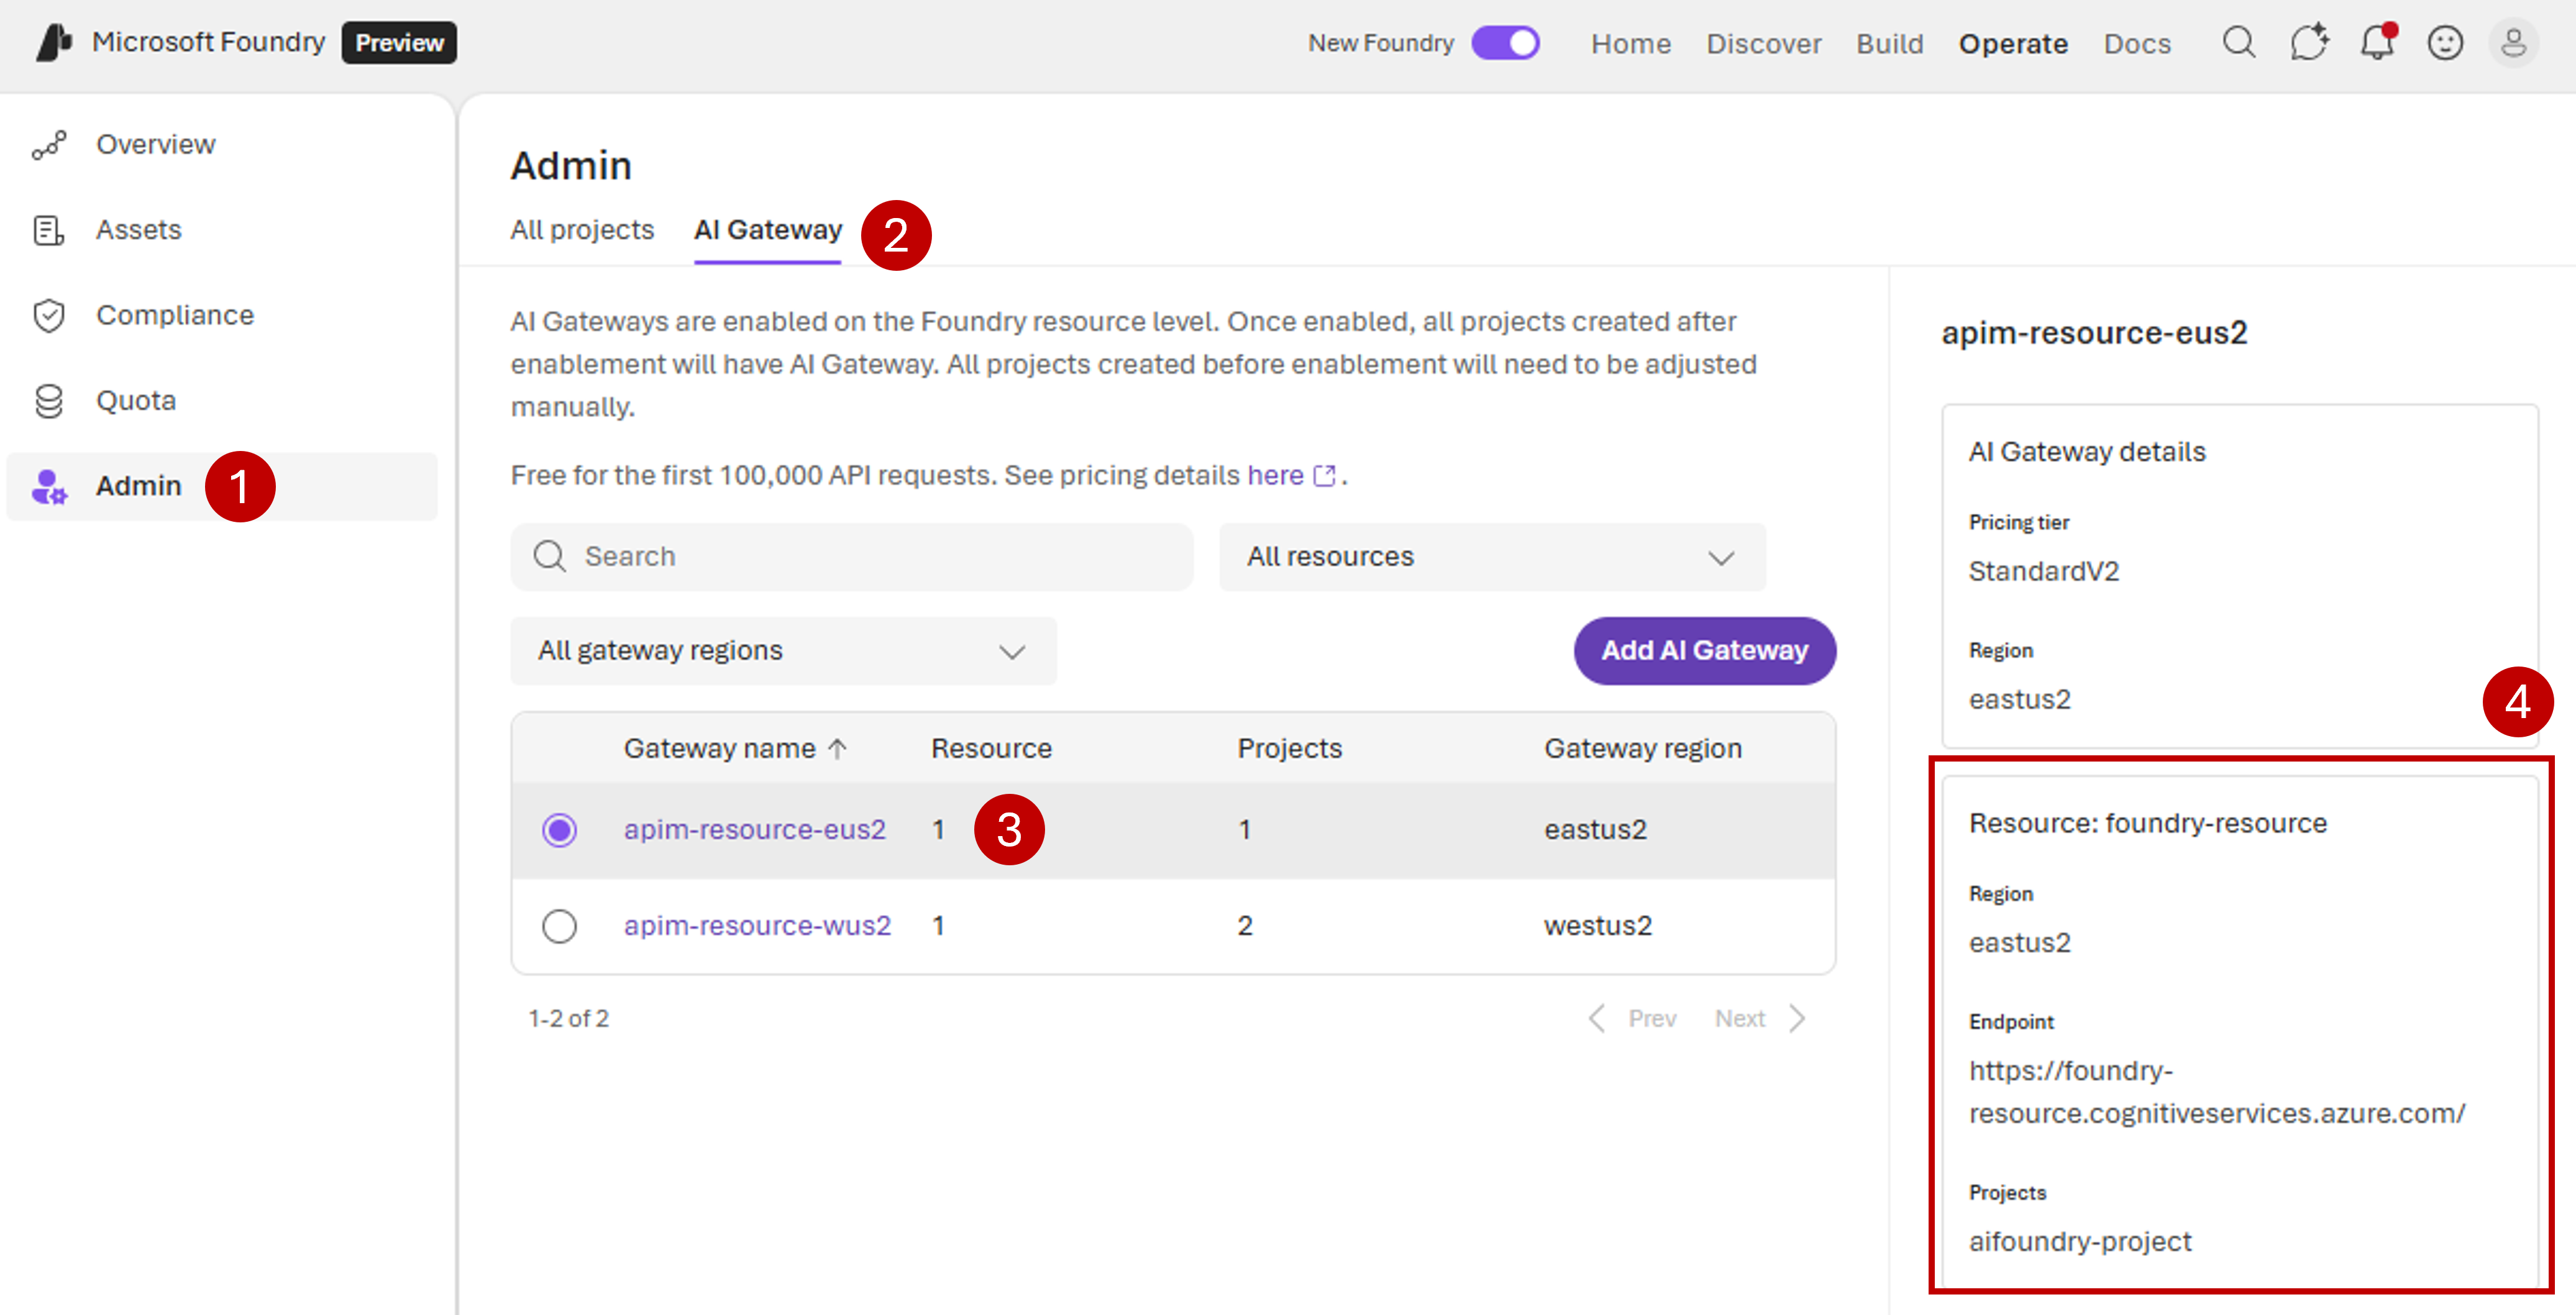
- If the Foundry resource that you want to use doesn’t have an AI gateway configured (it isn’t listed), add one by using the Add AI Gateway option. An AI gateway is free to set up and unlocks powerful governance features like security, diagnostic data, and rate limits for your agents, tools, and models. For more information, see Create an AI gateway.
-
Ensure that you have observability configured in the project. Foundry Control Plane uses the Application Insights resource associated with your selected project for emitting data to help you diagnose your agent.
- On the toolbar, select Operate.
- On the left pane, select Admin.
- Under All projects, use the search box to look for your project.
- Select the project.
- Select the Connected resources tab.
- Ensure that there’s an associated resource in the AppInsights category.
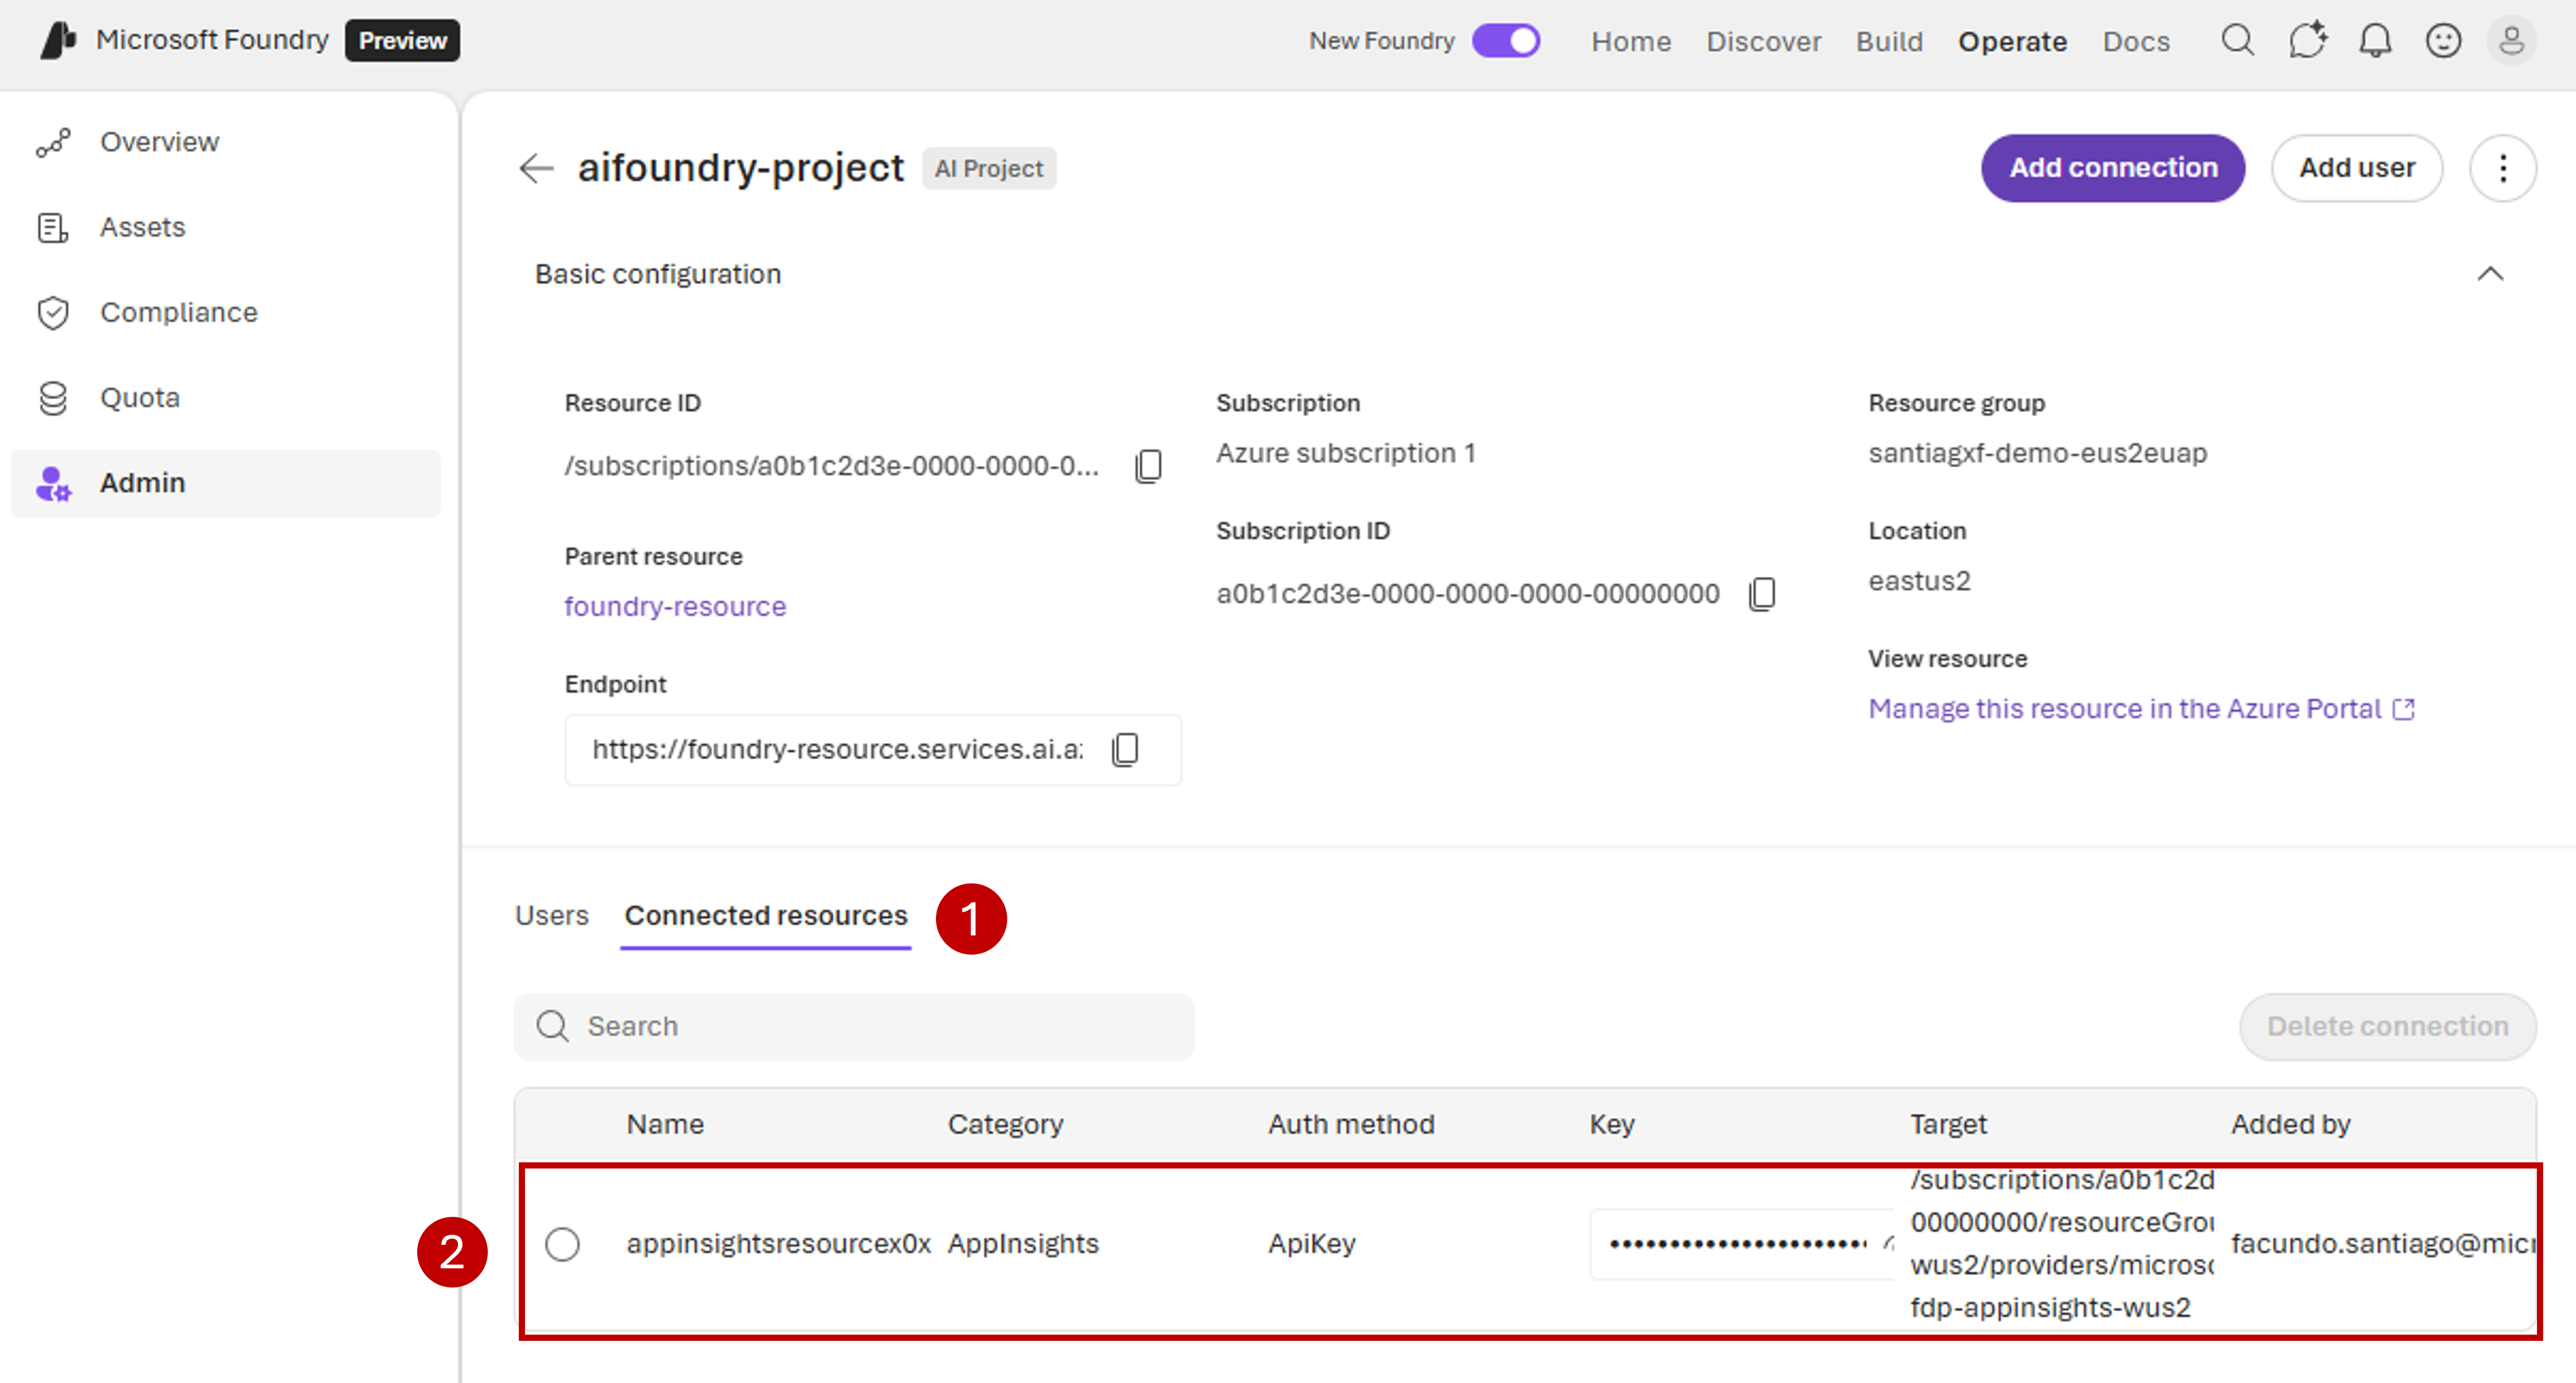
- If there’s no associated resource, add one by selecting Add connection > Application Insights.
Register the agent (asset)
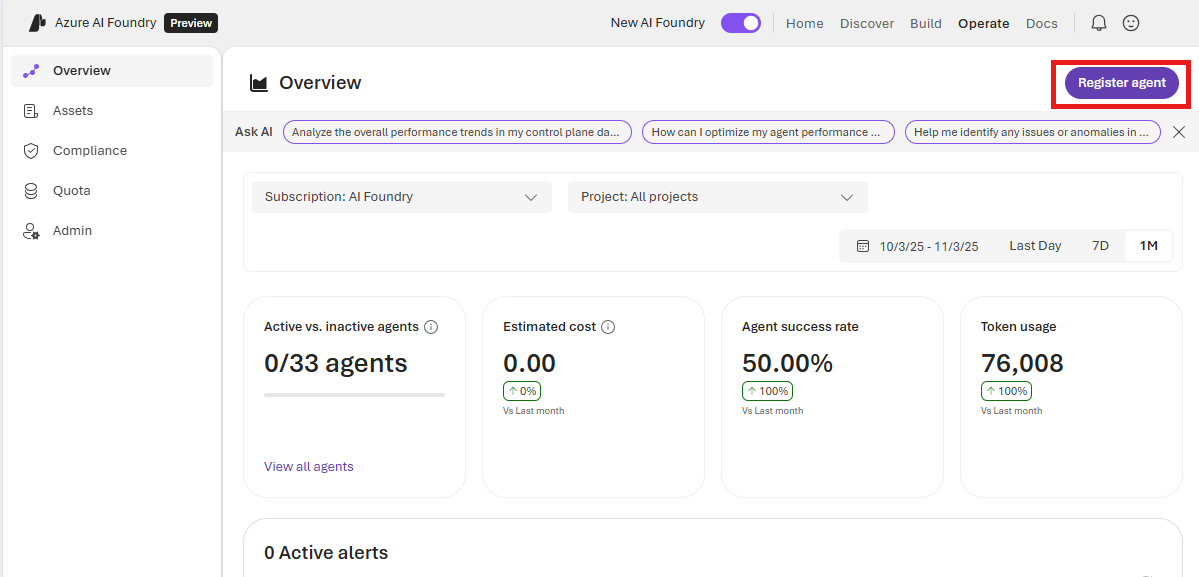
- On the toolbar, select Operate.
- On the Overview pane, select Register asset.
-
The registration wizard appears. First, complete the details about the agent that you want to register. The following properties describe the agent as it runs on its platform:
Property Description Required Agent URL The endpoint (URL) where your agent runs and receives requests. In general, but depending on your protocol, you indicate the base URL that your clients use. For example, if your agent uses the OpenAI Chat Completions API, you indicate https://<host>/v1/without/chat/completionsbecause clients generally add it.Yes Protocol The communication protocol that your agent supports. Use HTTP in general. Or if your agent supports A2A more specifically, indicate that one. Yes A2A agent card URL The path to the agent card’s JSON specification. If you don’t specify it, the system uses the default /.well-known/agent-card.json.Yes, when Protocol is A2A OpenTelemetry agent ID The agent ID that your agent uses to emit traces according to OpenTelemetry semantic conventions for generative AI. Traces indicate it in the gen_ai.agent.idattribute for spans with the operation namecreate_agent. If you don’t specify this value, the system uses the Agent name value to find traces and logs that this new agent reports.No Admin portal URL The administration portal URL where you can perform further administration operations for this agent. Foundry can store this value for convenience. Foundry doesn’t have any access to perform operations directly to this portal. No -
Configure how you want the agent to appear in Foundry Control Plane:
Property Description Required Project The project where you register the agent. Foundry uses the AI gateway configured in the resource that contains the project to configure the inbound endpoint to the agent. You can select only projects that have an AI gateway enabled in their resources. If you don’t see any AI gateways, configure an AI gateway in your Foundry resource. We also recommend that you configure Application Insights in the selected project. Foundry uses the project’s Application Insights resource to sink traces and logs. Yes Agent name The name of the agent as you want it to appear in Foundry. The system might also use this name to find relevant traces and logs in Application Insights if you don’t specify a different value for OpenTelemetry agent ID. Yes Description A clear description about this agent. No - Save the changes.
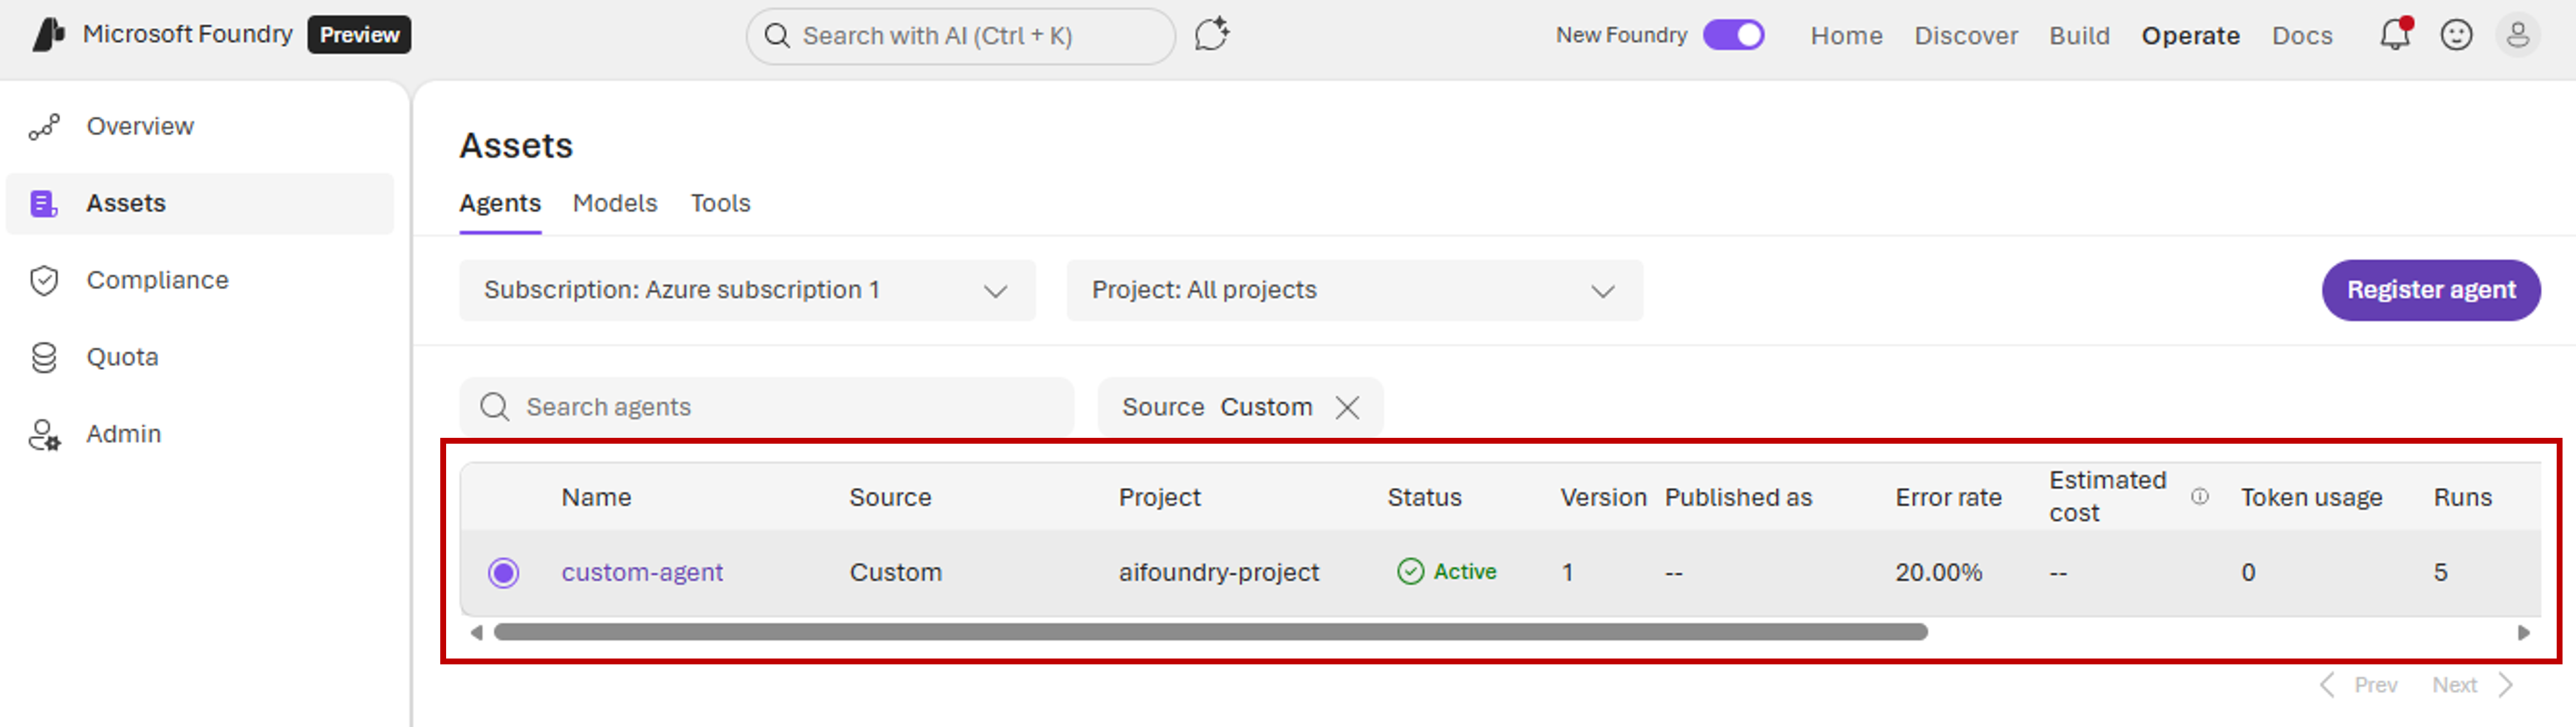
- Foundry adds the new agent. To check the list of agents, select Assets on the left pane.
- To show only custom agents, use the Source filter and select Custom.
Connect clients to the agent
When you register your agent in Foundry, you get a new URL for your clients to use. Because Foundry acts as a proxy for communications to your agent, it can control access and monitor activity. To distribute the new URL so that your clients can call the agent:- In the agents list, select the radio button next to the custom agent’s name to open the information pane. Don’t select the agent name itself, because that link navigates away from the Assets pane.
- On the information pane, under Agent URL, select the Copy option.

- Use the new URL to call the agent instead of the original endpoint.
Although Foundry acts as a proxy for incoming requests for your agent, the original authorization and authentication schema in the original endpoint still applies. When you consume the new endpoint, provide the same authentication mechanism as if you’re using the original endpoint.
Block and unblock the agent
For custom agents, Foundry doesn’t have access to the underlying infrastructure where the agent runs, so start and stop operations aren’t available. However, Foundry can block incoming requests to the agent so that clients can’t consume it. This capability allows administrators to disable an agent if it misbehaves. To block incoming requests to your agent:- On the toolbar, select Operate.
- On the left pane, select Assets.
- Select the radio button next to the agent that you want to block. The information pane appears. Don’t select the agent name, because that link navigates away from the Assets pane.
- Select Update status, and then select Block.
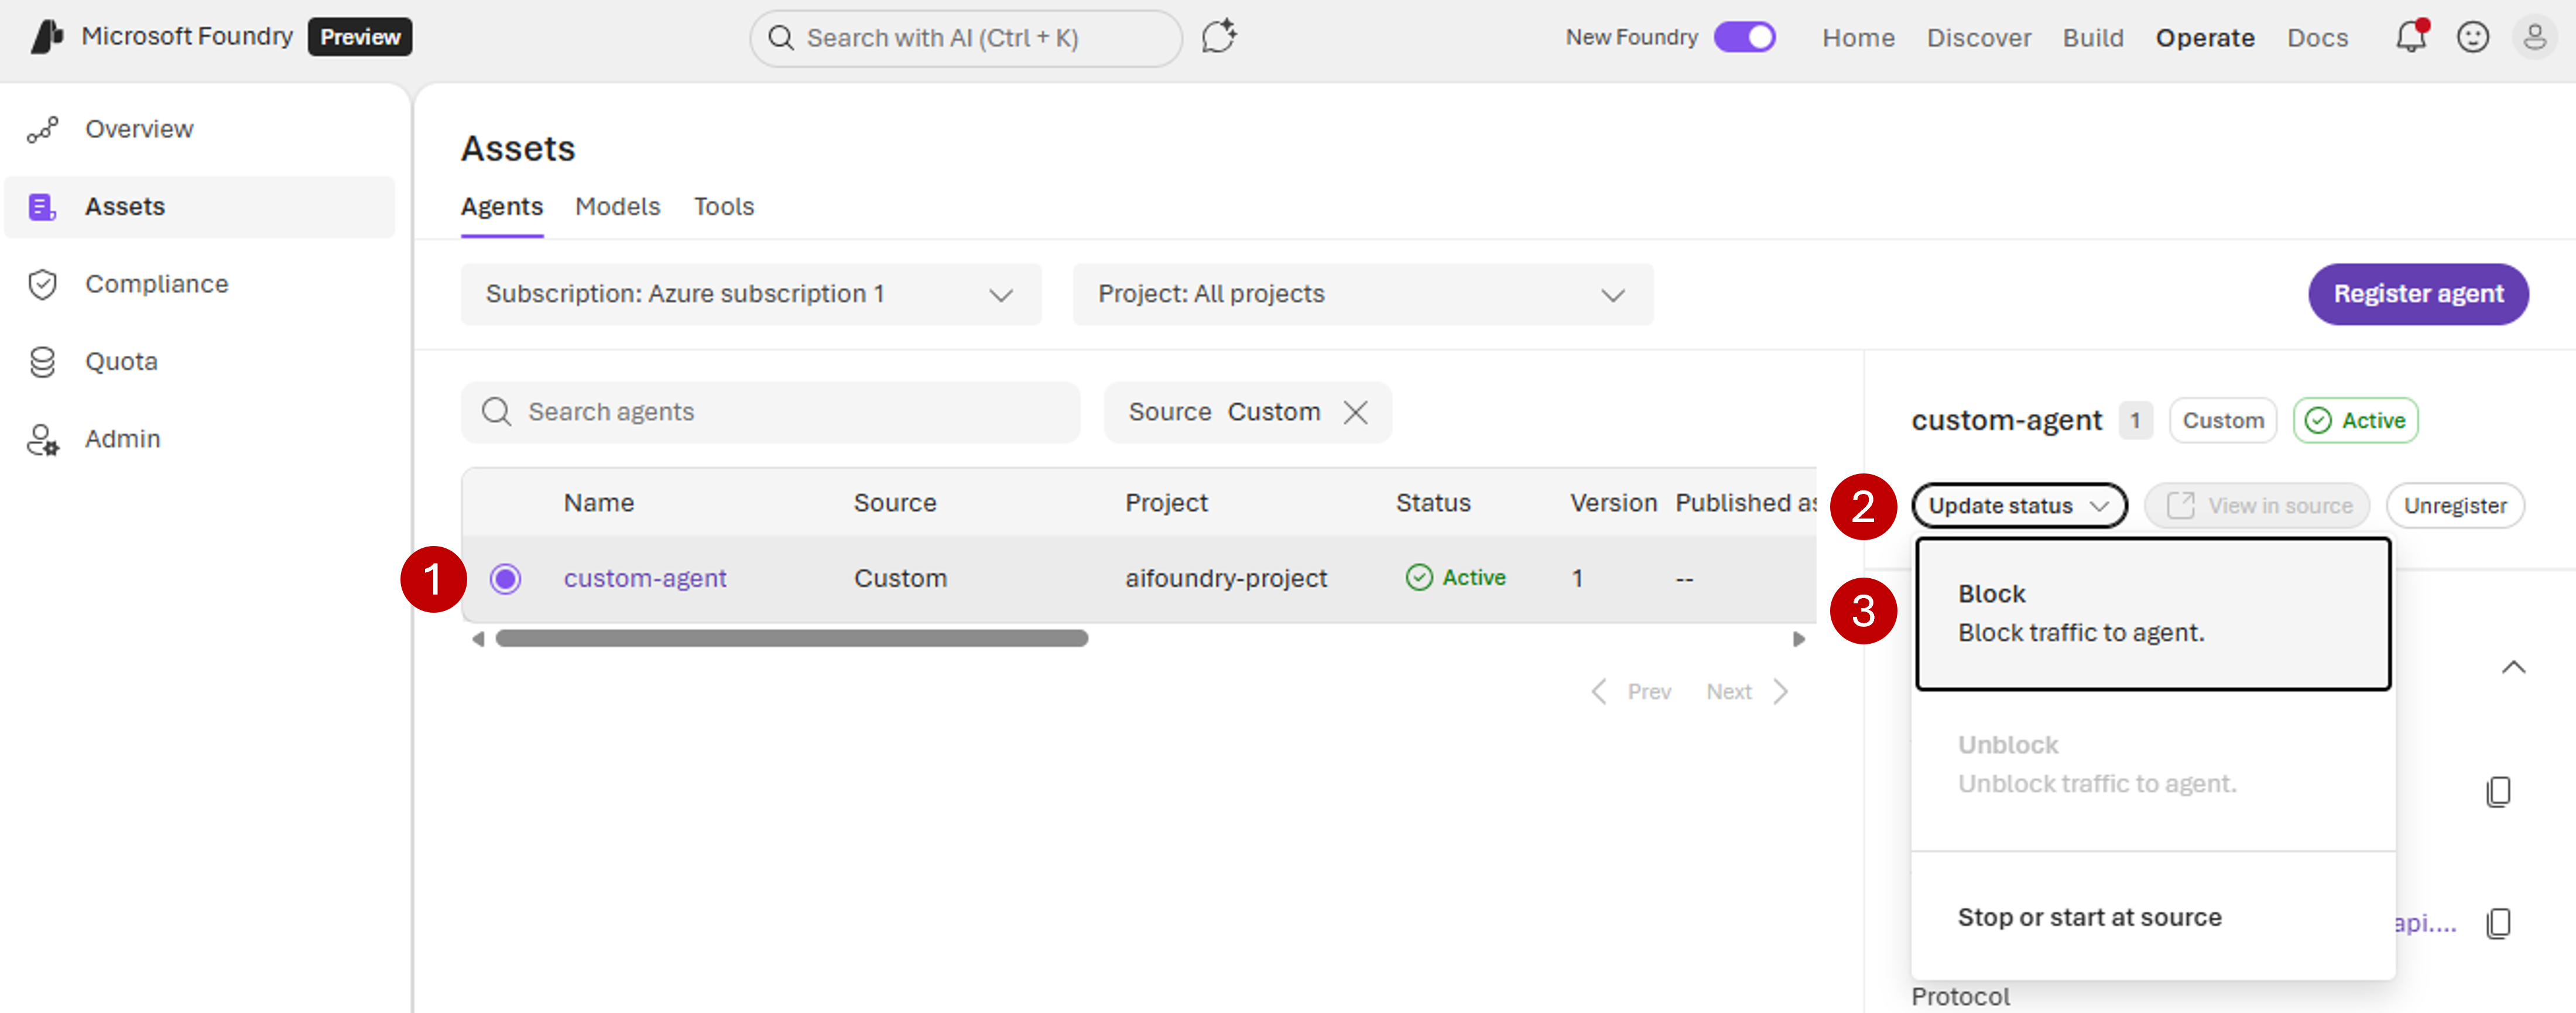
- Confirm the operation.
- Select Update status, and then select Unblock.
- Confirm the operation.
Enable diagnostic data for the agent
Foundry uses the OpenTelemetry open standard to understand what agents are doing. If your project has Application Insights configured, Foundry logs requests into Application Insights by default. Foundry also uses this data to compute:- Runs
- Error rate
- Usage (if available)
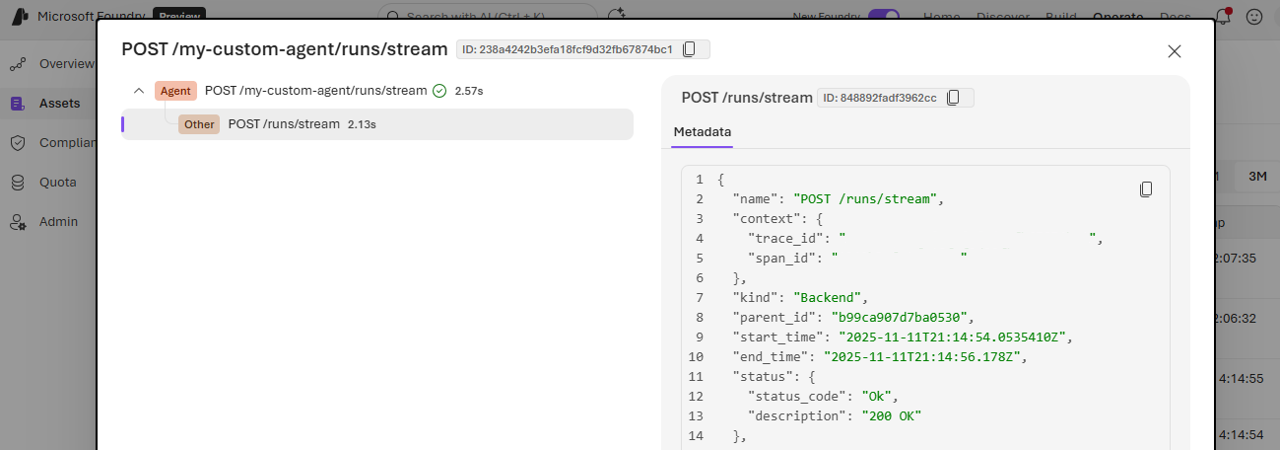
View traces and logs sent to Foundry
- On the toolbar, select Operate.
- On the left pane, select Assets.
- Select the radio button next to the agent to open the information pane. Don’t select the agent name, because that link navigates away from the Assets pane.
- The Traces section shows one entry for each HTTP call made to the agent’s endpoint. To see the details, select an entry.
Instrument custom code agents
If you build your agent by using custom code, instrument your solution to emit traces according to the OpenTelemetry standard and send them to Application Insights. Instrumentation gives Foundry access to detailed information about what your agent is doing. Send traces to the Application Insights resource of your project by using its instrumentation key. To get the instrumentation key associated with your project, follow the instructions at Connect Application Insights to your Foundry project. In this example, you configure an agent developed with LangGraph to emit traces in the OpenTelemetry standard. The tracer captures all agent operations, including tool calls and model interactions. The tracer then sends the operations to Application Insights for monitoring. This code uses the langchain-azure-ai package. For guidance on instrumenting specific solutions with OpenTelemetry, depending on the programming language and framework that your solution uses, see Language APIs & SDKs.Instrument platform solutions
If your agent runs on a platform solution that supports OpenTelemetry but doesn’t support Application Insights, deploy an OpenTelemetry collector and configure your software to send OTLP data to the collector (standard OpenTelemetry configuration). Configure the collector with the Azure Monitor exporter to forward data to Application Insights by using your connection string. For details about how to implement it, see Configure Azure Monitor OpenTelemetry.Troubleshoot traces
If you don’t see traces, check the following items:- The project where you register your agent has Application Insights configured. If you configured Application Insights after you registered the custom agent, you need to unregister the agent and register it again. Application Insights configuration isn’t automatically updated after registration if you changed it.
- You configured the agent (running on its infrastructure) to send traces to Application Insights, and you’re using the same Application Insights resource that your project uses.
- Instrumentation complies with OpenTelemetry semantic conventions for generative AI.
- Traces include spans with attribute
gen_ai.operation.name="create_agent"andgen_ai.agent.id="<agent-id>"(orgen_ai.agent.name="<agent-id>"). In the latter attribute,"<agent-id>"is the OpenTelemetry agent ID value that you configured during registration.