Compare models using the model leaderboard (preview)
This article refers to the Microsoft Foundry (new) portal.
- Model leaderboard to quickly identify top-performing models for quality, safety, estimated cost, and throughput leaderboards
- Trade-off charts to visually compare model performance across two metrics, such as quality versus cost
- Leaderboards by scenario to find the most relevant benchmark leaderboard for your specific scenario
- Compare models to evaluate features, performance, and estimated cost in a side-by-side view
Items marked (preview) in this article are currently in public preview. This preview is provided without a service-level agreement, and we don’t recommend it for production workloads. Certain features might not be supported or might have constrained capabilities. For more information, see Supplemental Terms of Use for Microsoft Azure Previews.
Prerequisites
- An Azure subscription with a valid payment method. Free or trial Azure subscriptions won’t work. If you don’t have an Azure subscription, create a paid Azure account to begin.
- A Foundry project.
- At least Reader role on the Foundry project. For more information, see Role-based access control in Foundry.
- Access to the Foundry portal.
Access model leaderboards
Use the model catalog to access the leaderboard and identify top-performing models.- If you’re not already in your project, select it.
- Select Discover from the top navigation bar to browse the model catalog. The overview page shows a snapshot of the model leaderboard at the top.
- Sort on different metrics — quality, safety, estimated cost, and throughput — to view the top models for each criterion. Select any model to go to its detail page, or select Go to leaderboard to view the full list. The model detail page shows the model’s overview, benchmarks, and deployment options.
- On the Model leaderboard page, view the top leaders for quality, safety, throughput, and estimated cost. Expand these charts to visually view the top 10. Each expanded chart shows a bar graph of the top 10 models for that metric.
- Scroll past the charts to find the full model leaderboard. Sort on the metrics you care most about and select a model name to go to its detail page. The leaderboard table appears with sortable columns for quality, safety, throughput, and estimated cost.
- Select two or three models for detailed feature comparison in a side-by-side view. The comparison view appears, showing features, performance, and estimated cost for your selected models.
Trade-off charts
The trade-off chart allows you to compare trade-offs visually based on the criteria that matter most to you. For example, suppose the highest-quality model isn’t the cheapest. You might need to make trade-offs among quality, safety, cost, and throughput criteria. In the trade-off chart, you can compare how models perform along two metrics at a glance. Use the trade-off chart on the model leaderboard page to visualize how models balance competing criteria:- Use the Compare quality against dropdown to switch between estimated cost, throughput, or safety comparisons.
- Add or remove models from the trade-off chart using the model selector on the right side of the chart.
- Hover over a data point to view the exact scores for the selected model. Models closer to the top-right corner of the chart perform well on both axes.
View leaderboards by scenario
Suppose you have a scenario that requires certain model capabilities. For example, if you’re building a question-answering chatbot that needs strong reasoning capabilities and resistance to harmful content, compare models in capability-specific leaderboards.- On the model leaderboard page, scroll to the Leaderboards by scenario section.
- Select a scenario category, such as Reasoning, Coding, or Question answering.
- Review the ranked list of models for your selected scenario. The leaderboard shows how models perform on benchmarks that are specific to that capability.
Compare models
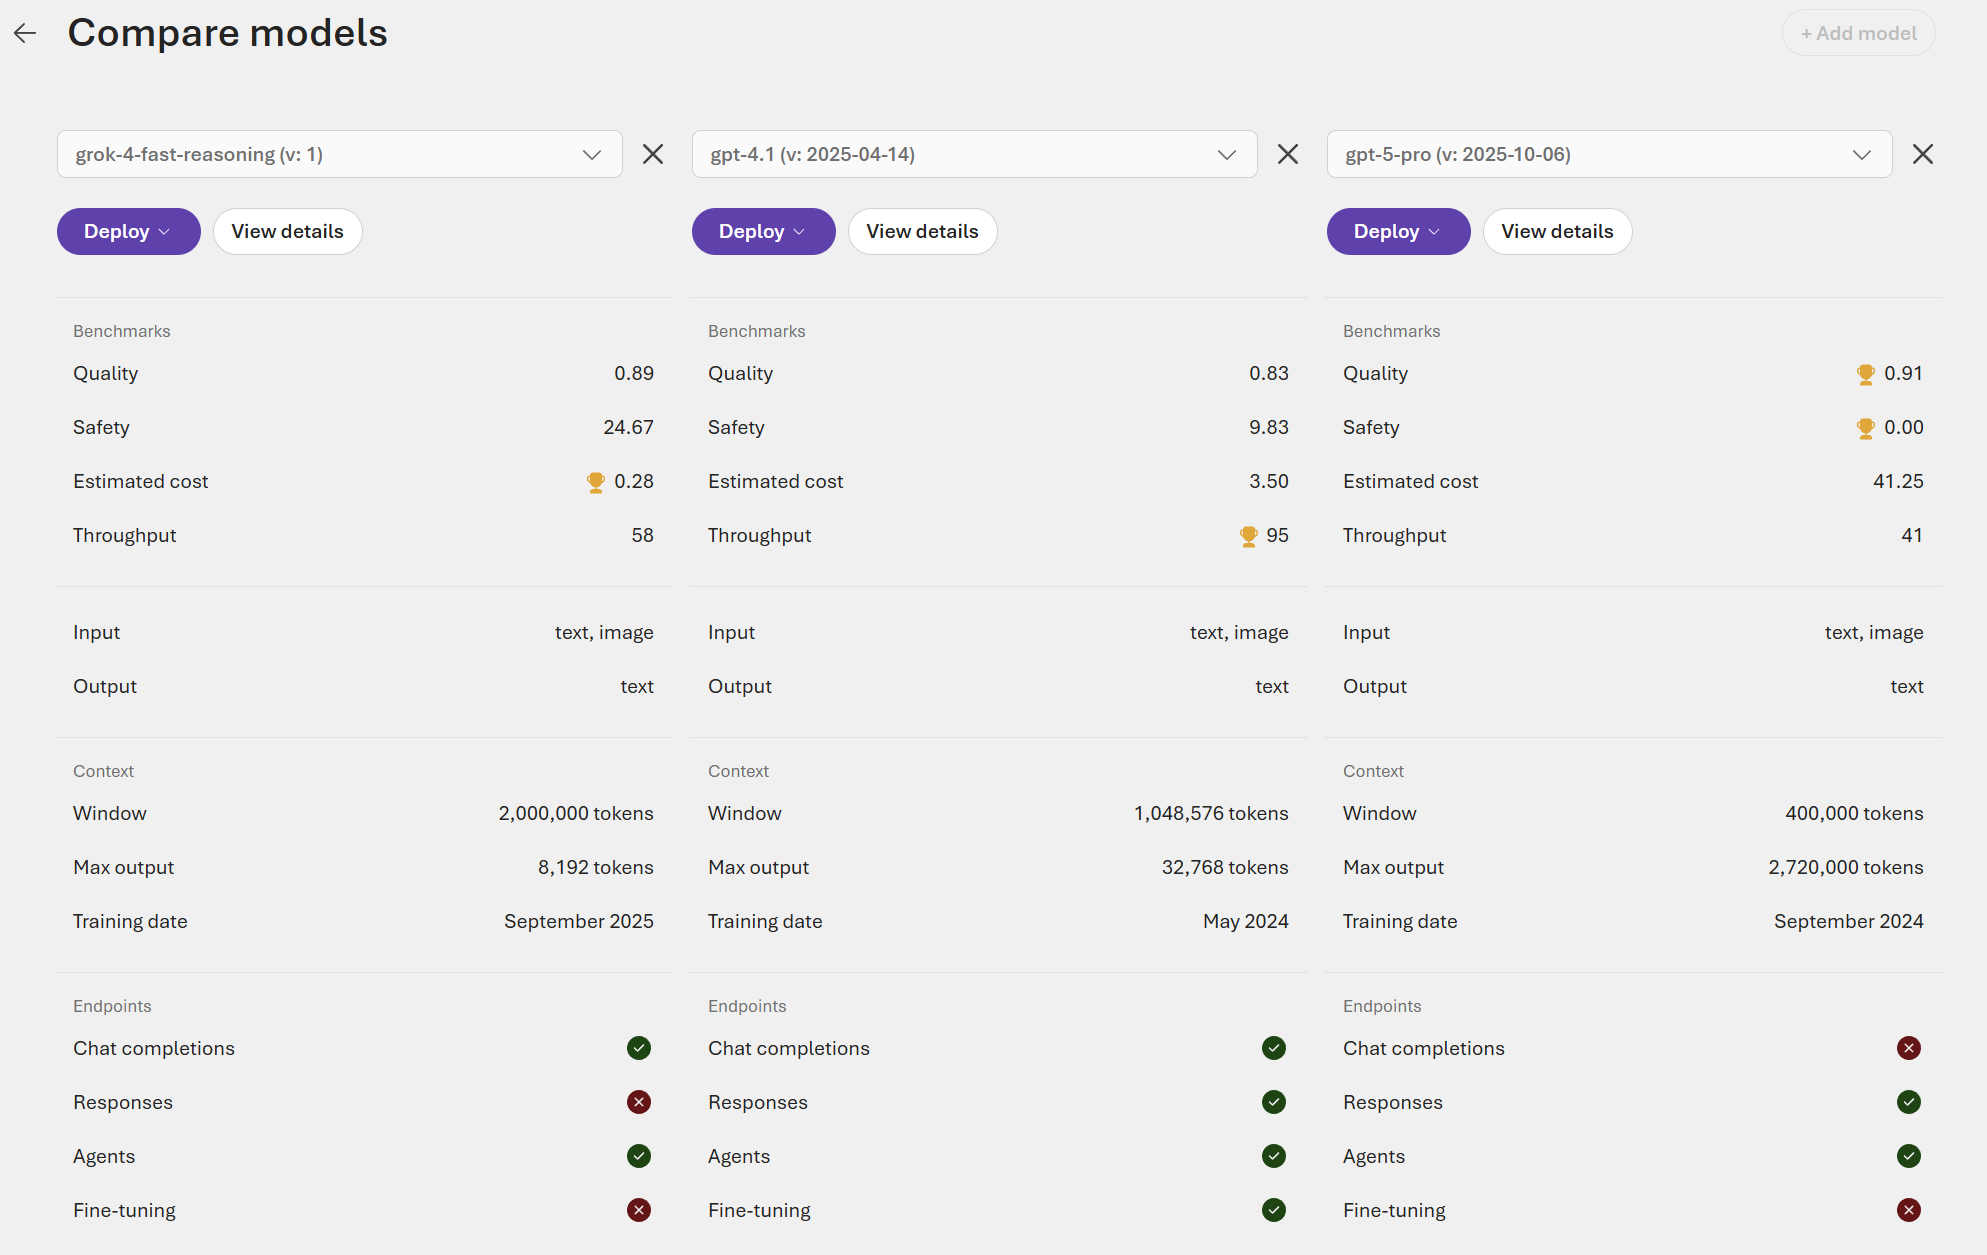
The side-by-side comparison view lets you evaluate up to three models simultaneously across multiple dimensions.- From the model leaderboard, select two or three models by checking the boxes next to their names.
- Select Compare to open the side-by-side comparison view.
-
Review the comparison across the following tabs:
- Performance benchmarks: Quality, safety, and throughput scores from public datasets
- Model details: Context window, training data, and supported languages
- Supported endpoints: Deployment options such as serverless API and managed compute
- Feature support: Capabilities like function calling, structured output, and vision
- To learn more about a specific model, select View details. If you’re ready to start using a model, select Deploy.
View model benchmarks
To view benchmarks for a specific model, select the model name from the leaderboard or search for it in the model catalog. On the model detail page, select the Benchmarks tab.Benchmark data isn’t available for all models in the catalog. If a model doesn’t have a Benchmarks tab, benchmark results haven’t been published for that model yet. Benchmarking results conducted by Microsoft are available for select models. Benchmarking information reported by providers is included when available.
- Public data benchmark results: High-level aggregate scores for AI quality, safety, estimated cost, latency, and throughput that provide a quick overview of the model’s performance.
- Comparative charts: These charts display the model’s relative position compared to related models.
- Metric comparison table: This table presents detailed results for each metric.
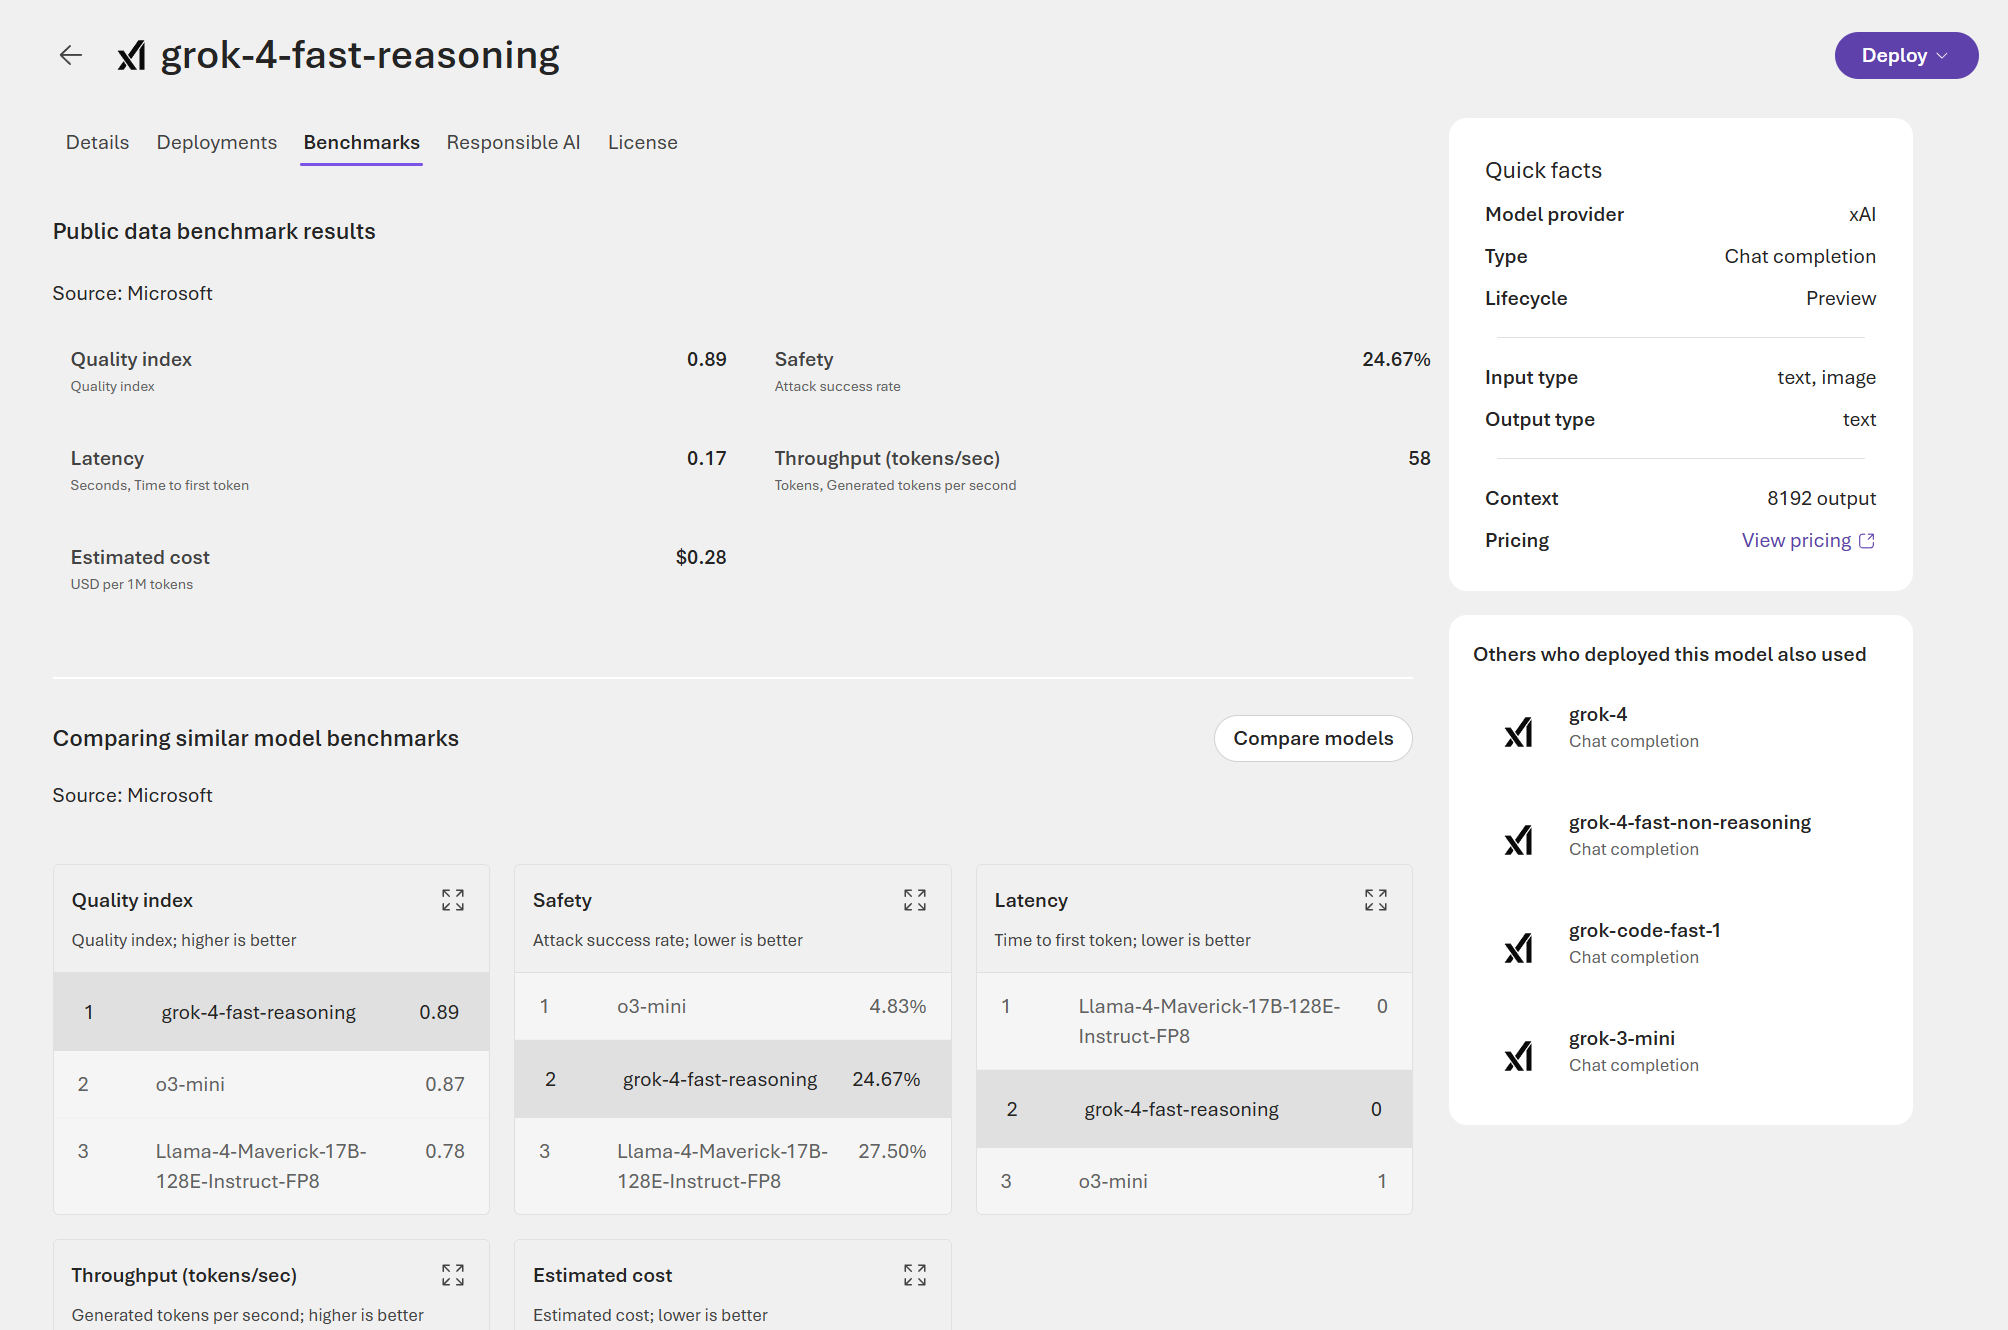
- Select the expand button on the chart. The pop-up comparison chart reveals detailed information and offers greater flexibility for comparison.
- Select the metric of interest and choose different datasets, based on your specific scenario. For more detailed definitions of the metrics and descriptions of the public datasets used to calculate results, select Read more.
The Try with your own data option on the benchmarks tab is available only in Foundry (classic). To evaluate a model with your own data in the new portal, see Evaluate generative AI apps.
Troubleshooting
| Issue | Resolution |
|---|---|
| Model doesn’t appear in leaderboard | Not all models are benchmarked. Check the model catalog for availability. |
| No Benchmarks tab on model card | Benchmark results haven’t been published for this model yet. |
| Benchmark scores differ from my results | Public benchmarks use standardized datasets and might not reflect performance on your specific data. To evaluate a model with your own data, see Evaluate generative AI apps. |
| Trade-off chart shows no data points | Ensure you have models selected in the model selector. At least two models are required for trade-off comparisons. |
| Can’t compare more than three models | The side-by-side comparison view supports a maximum of three models. Deselect a model before adding another. |
| Benchmark scores seem outdated | Microsoft updates benchmark scores periodically. Check the model detail page for the benchmark evaluation date. |
Related content
- Model leaderboards in Foundry portal - Learn about the benchmarks, datasets, and metrics behind the leaderboard scores.
- Evaluate generative AI apps with Foundry - Run evaluations on your own data to measure model performance for your scenario.
- View evaluation results in Foundry portal - Interpret and compare evaluation results across runs.