- Team managers gain oversight of agent operations and team productivity.
- Administrators enforce governance policies and track compliance posture.
- Cost managers optimize spending and identify resource inefficiencies.
- Security teams monitor for prohibited behaviors and policy violations.
Prerequisites
- An Azure account with an active subscription. If you don’t have one, create a free Azure account, which includes a free trial subscription.
- A Foundry project. If you don’t have one, create a project.
-
The following permissions:
- Read access to the project and subscription that you want to view data for
- Log Analytics Reader role or higher on the Application Insights resource that’s associated with your agent
- Cost Management Reader role
This capability is available only in the Foundry (new) portal. Look for  in the portal banner to confirm you’re using Foundry (new).
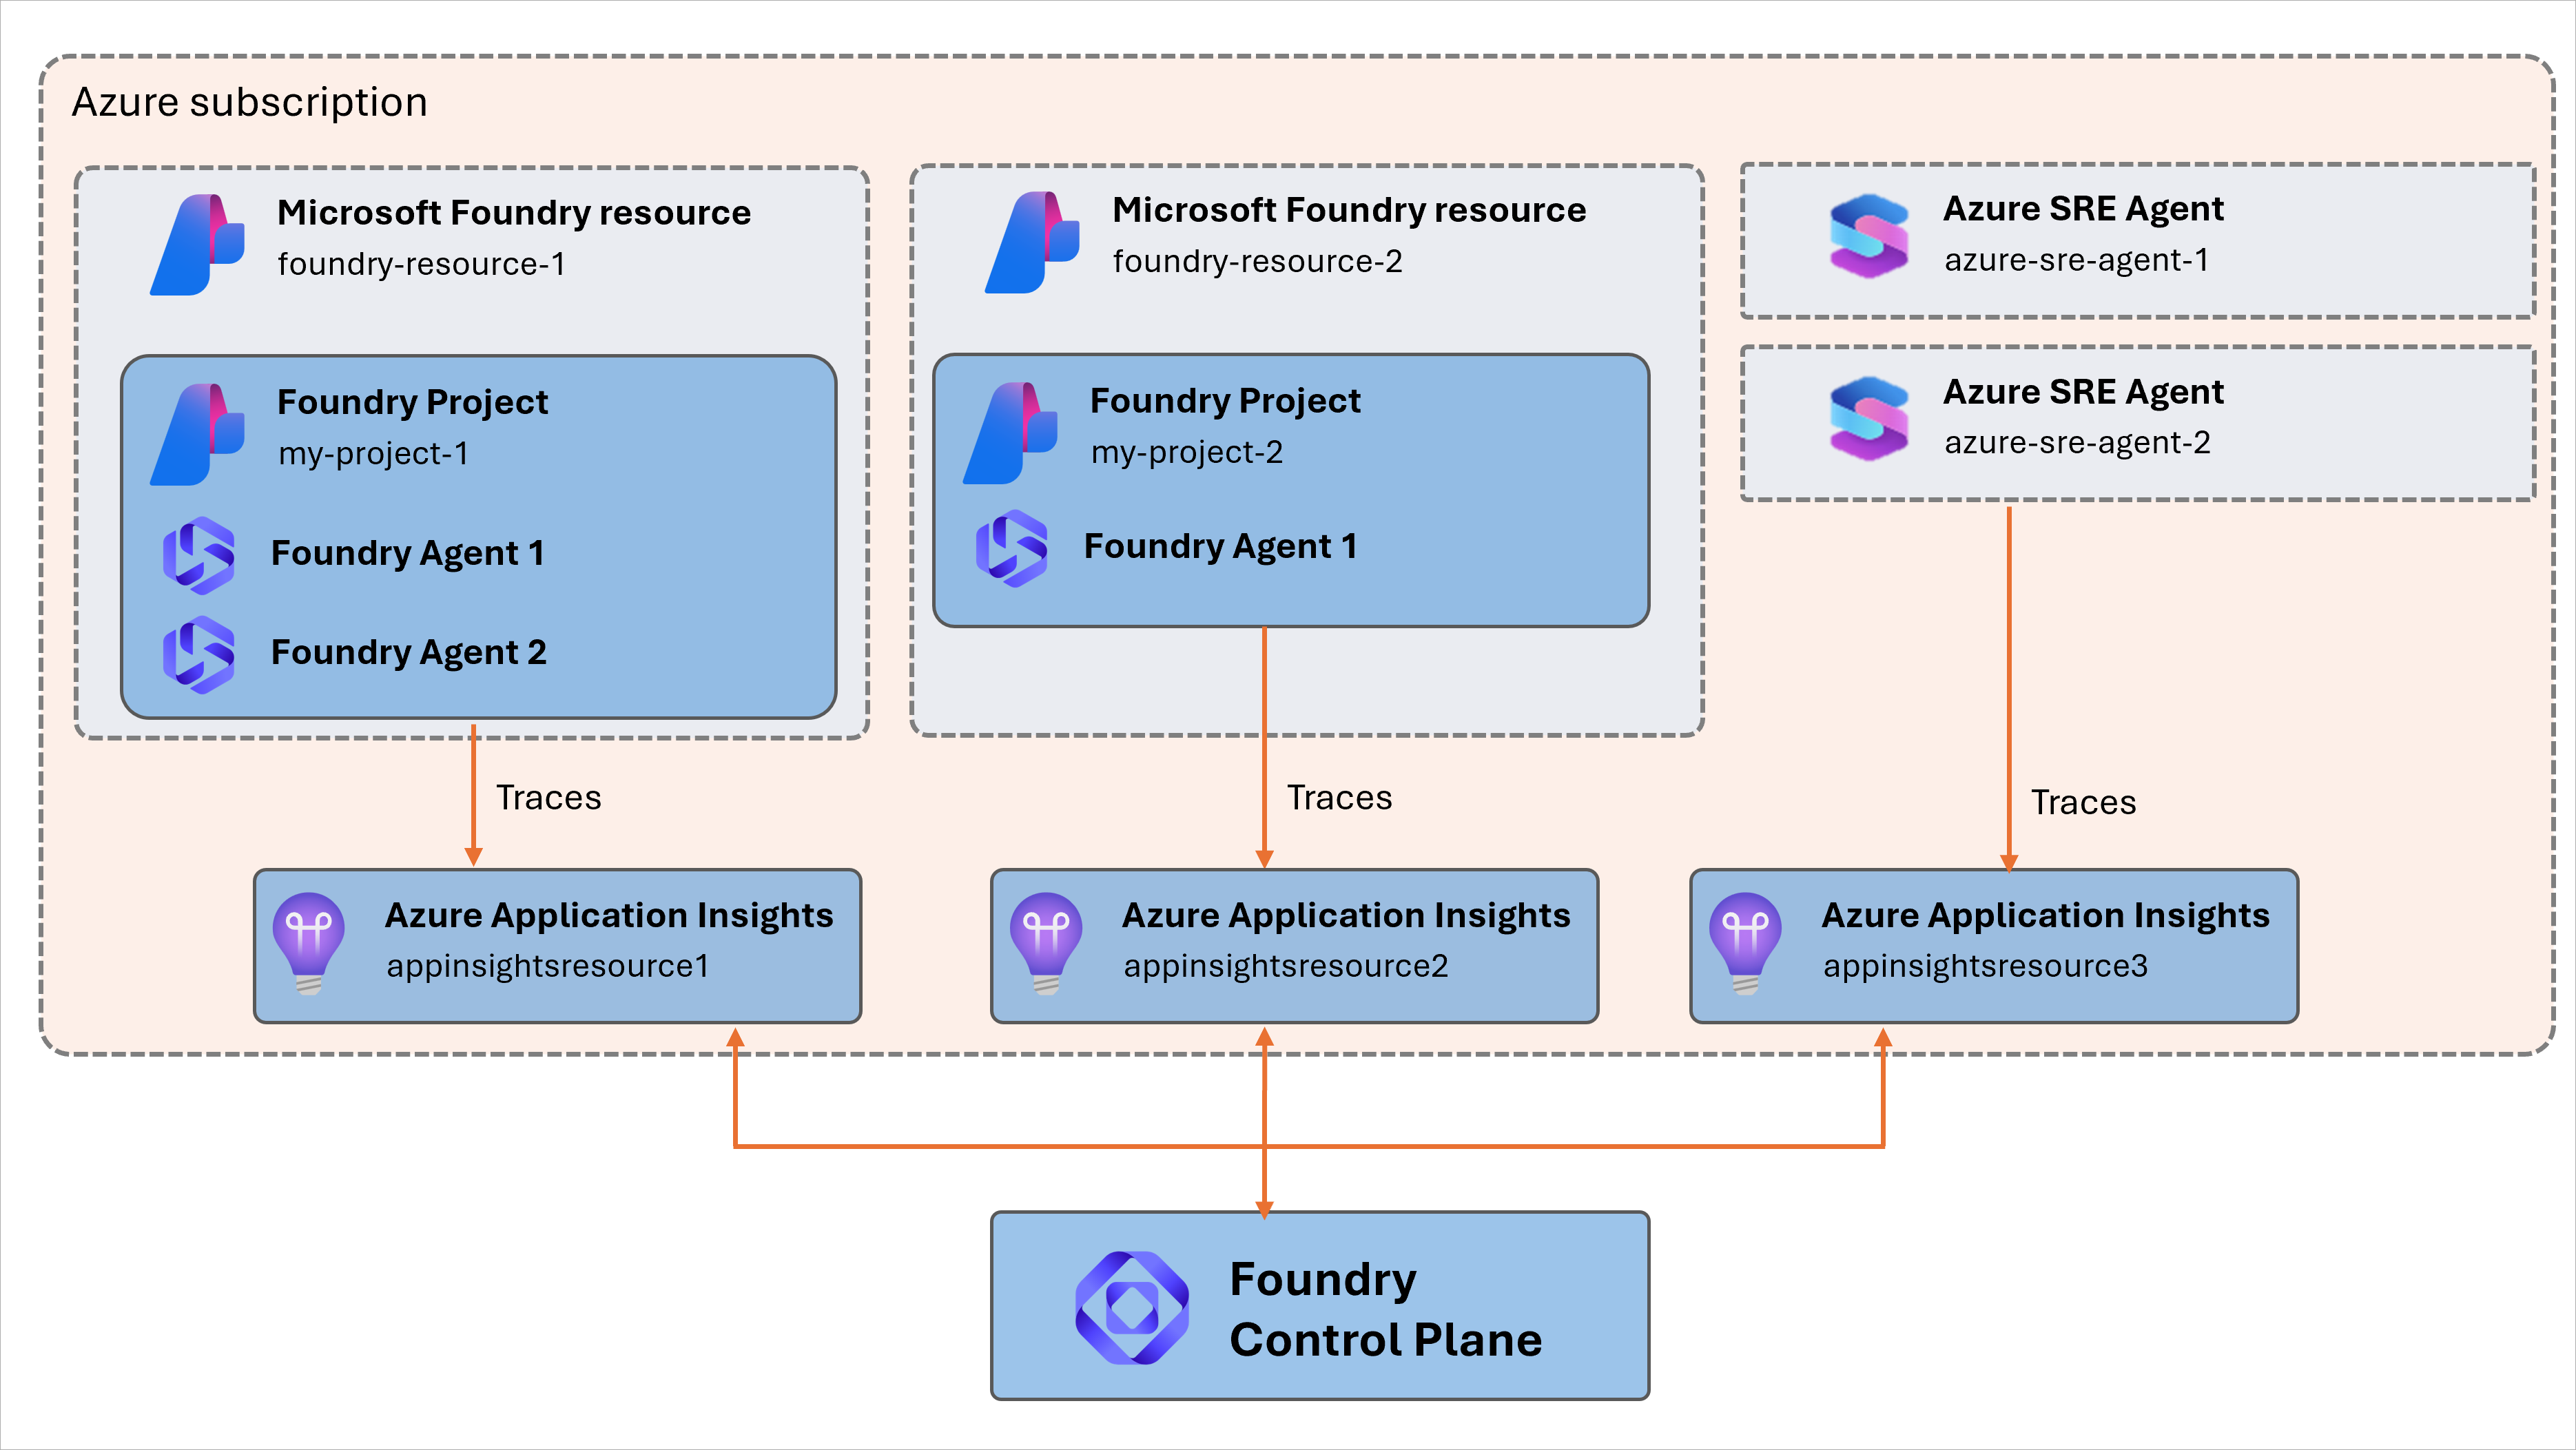
How monitoring works
Foundry Control Plane discovers all the agents that you can access. It uses the Application Insights resources that host your agents to help you monitor and diagnose those agents. Foundry Control Plane supports:- Foundry agents, including prompt-based agents, workflows, and hosted agents.
- Azure SRE Agent.
- Azure Logic Apps agent loops.
- Custom agents registered manually. Because Foundry Control Plane aggregates information across resources within the subscription, different users might see different agents listed, depending on their access.
- Fleet health metrics: Track active agents, run completion rates, and error trends across your entire fleet.
- Cost and performance tracking: Monitor token usage, budget consumption, and resource efficiency across all agents.
- Anomaly detection: Identify cost spikes, performance degradation, and emerging issues through trend analysis.
- Drill-down analysis: Move from fleet-level metrics to individual agent traces and logs for detailed investigation.
Agents running on resources without Application Insights don’t have health metrics, cost tracking, or drill-down traces.
Configure monitoring
Follow these steps for each project where you want to configure monitoring:- Sign in to Microsoft Foundry. Make sure the New Foundry toggle is on. These steps refer to Foundry (new).
- On the toolbar, select Operate.
- On the left pane, select Admin.
- Under All projects, in the search box, enter your project name.
- Select the project.
- Select the Connected resources tab.
- Verify that there’s an associated resource for the category AppInsights.
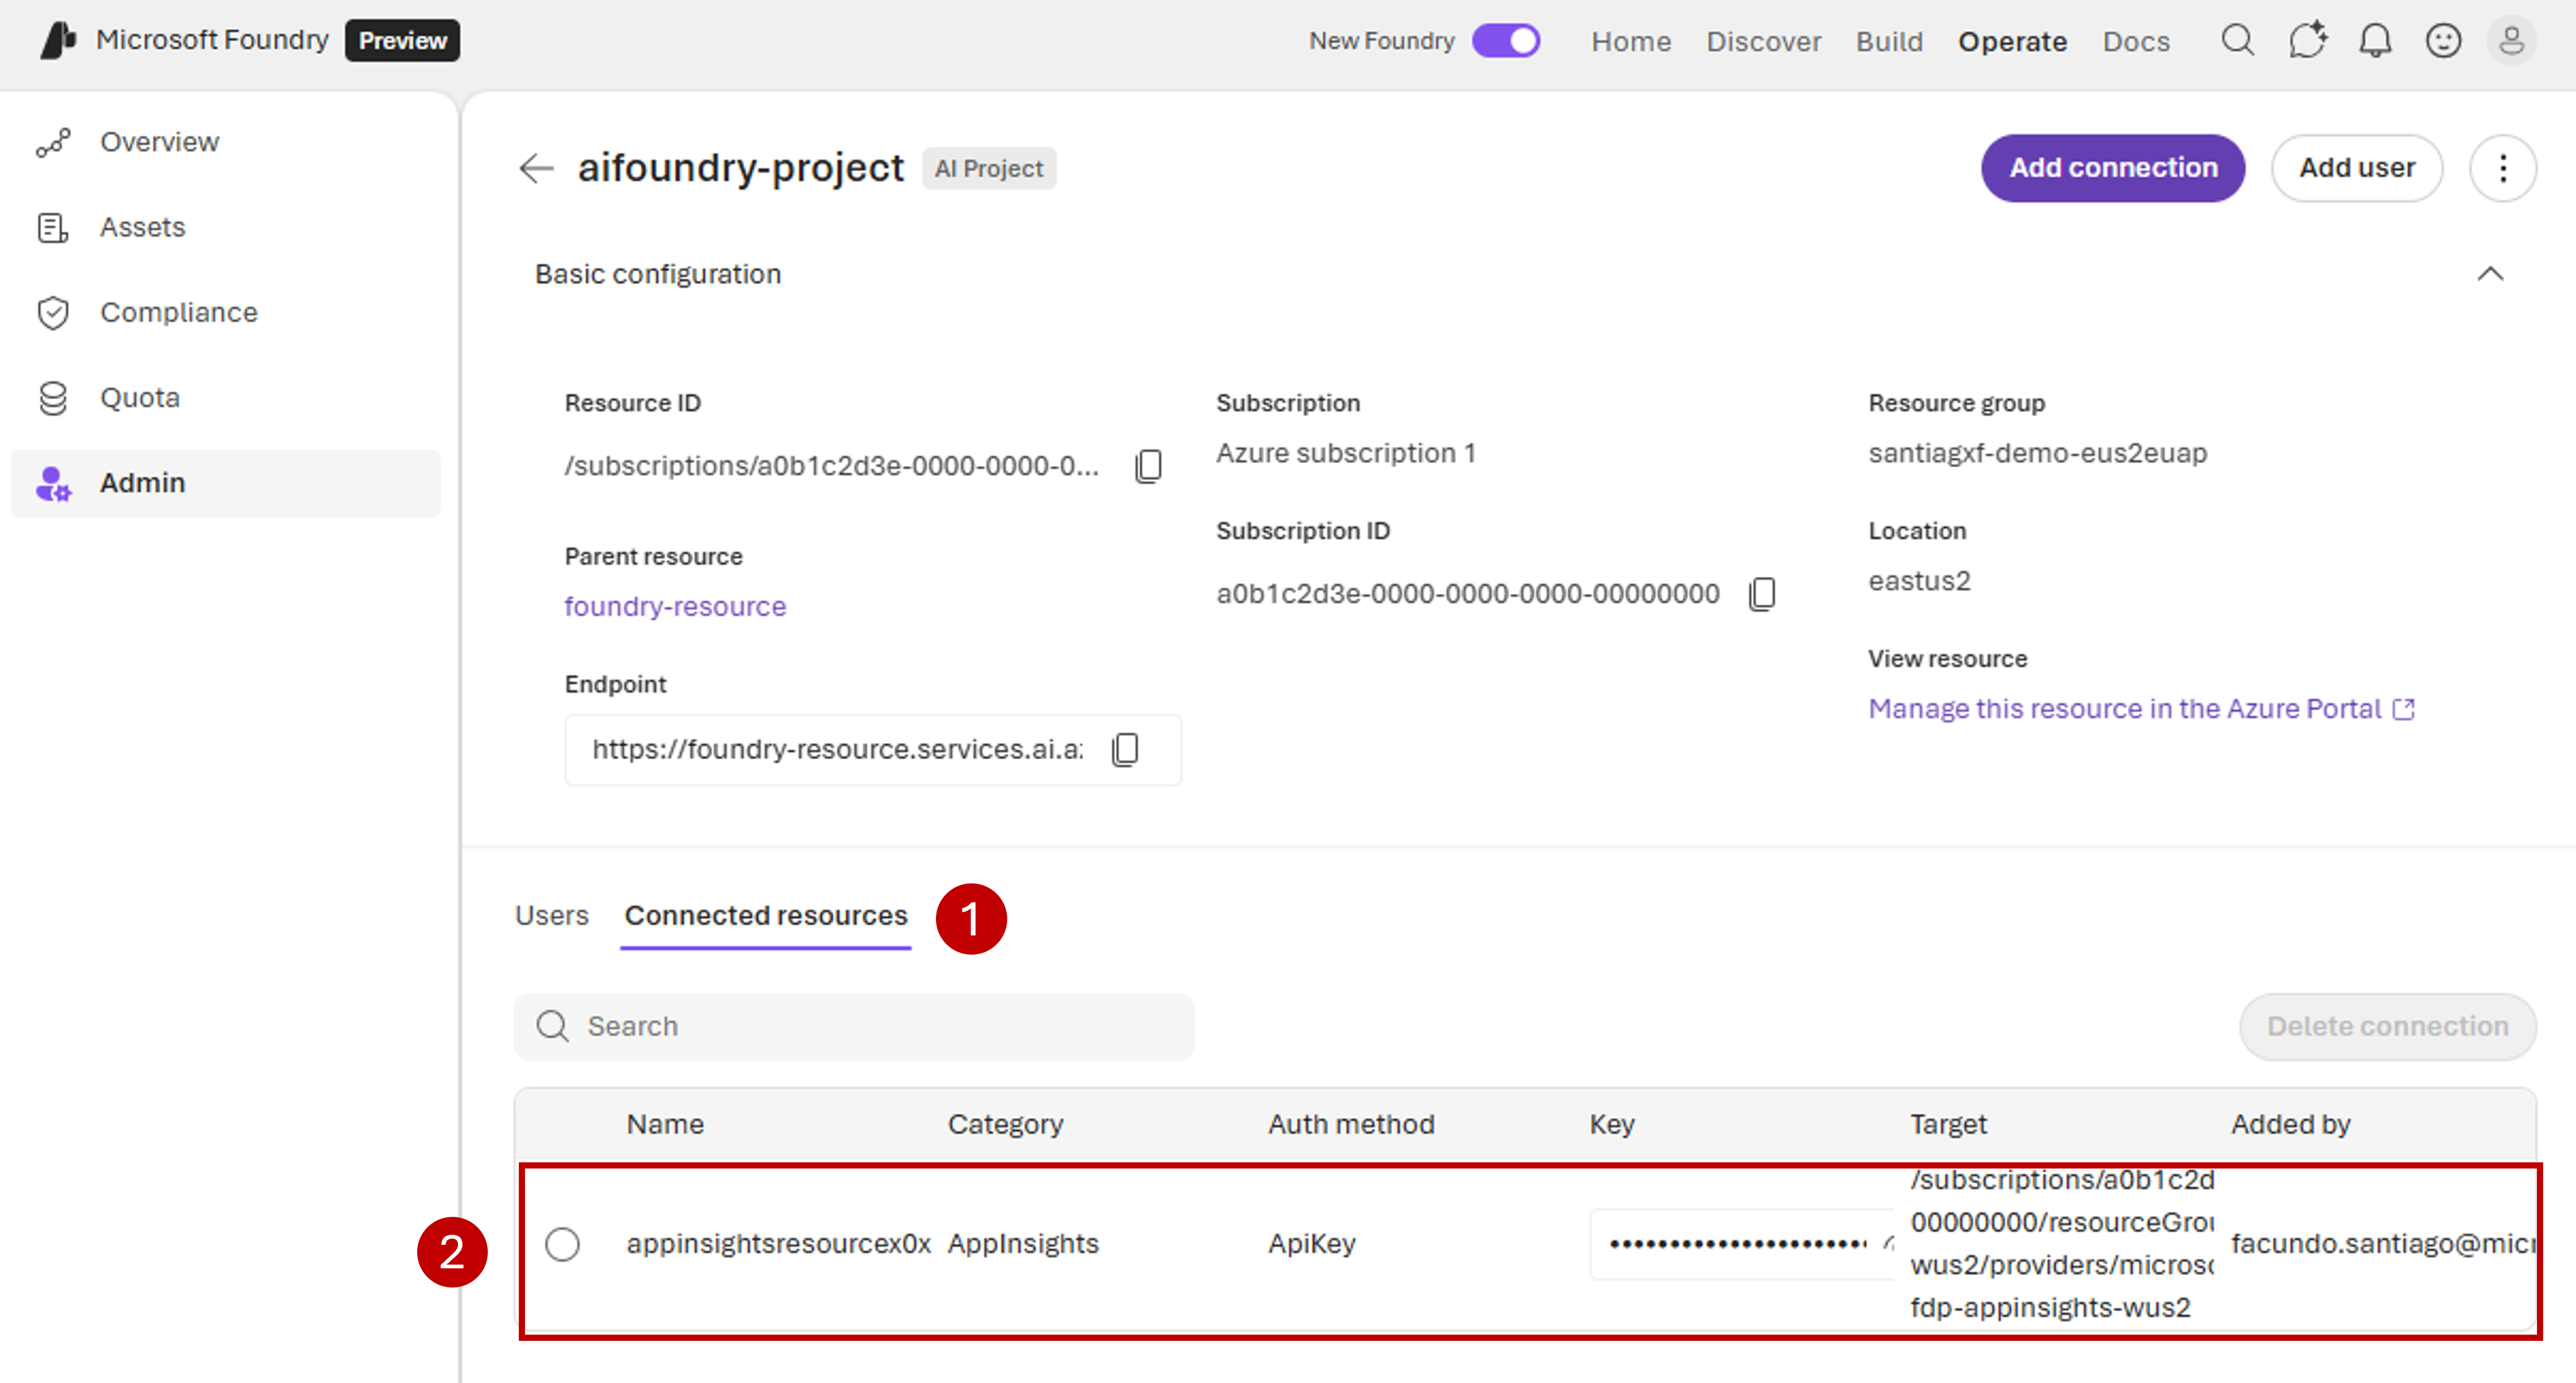
- If there’s no associated resource, add one by selecting Add connection and then selecting Application Insights.
View metrics
You can view aggregated metrics for all agents within a selected project by using Foundry. The Overview pane provides insights into fleet health, compliance, and performance trends.- Sign in to Microsoft Foundry. Make sure the New Foundry toggle is on. These steps refer to Foundry (new).
- On the toolbar, select Operate.
- Review the metrics displayed on the Overview pane, which shows common metrics and insights for all discovered agents within the subscription by default.
- From the project dropdown list, select a project to scope the metrics, if necessary.
- Select a date range by using the date selectors in the upper-right corner.
View individual agent metrics
You can view all your assets under a specific project, along with top-level metrics, from Foundry.- Sign in to Microsoft Foundry. Make sure the New Foundry toggle is on. These steps refer to Foundry (new).
- On the toolbar, select Operate.
- On the left pane, select Assets.
- Select the Agents tab.
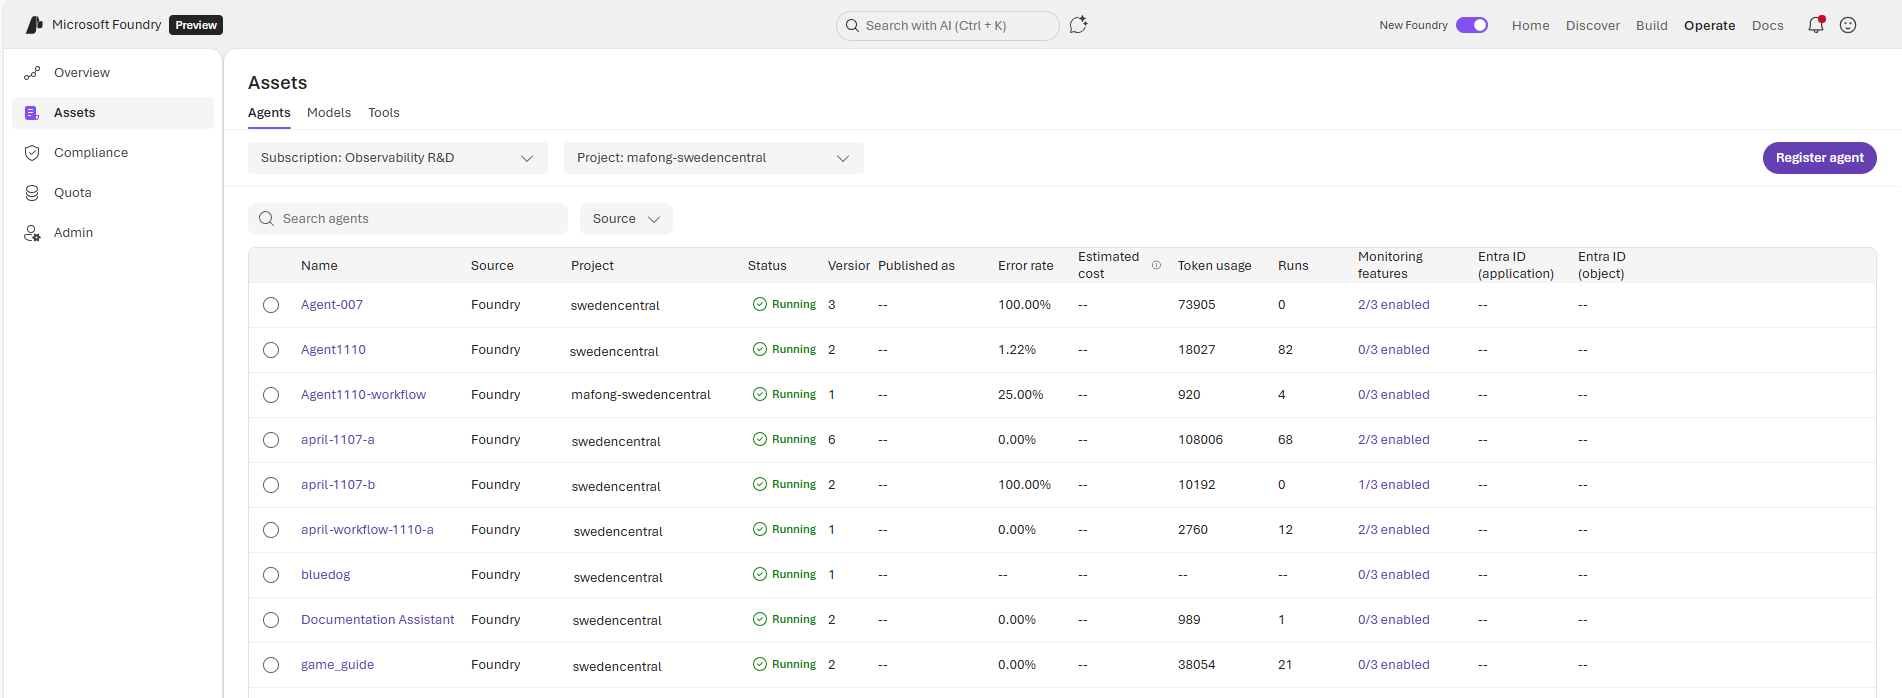
- To view more granular information on the performance of an individual agent, select an agent. The pane that appears provides quick insights into the selected agent’s health and recent activity. Use it to identify problems and take corrective actions.
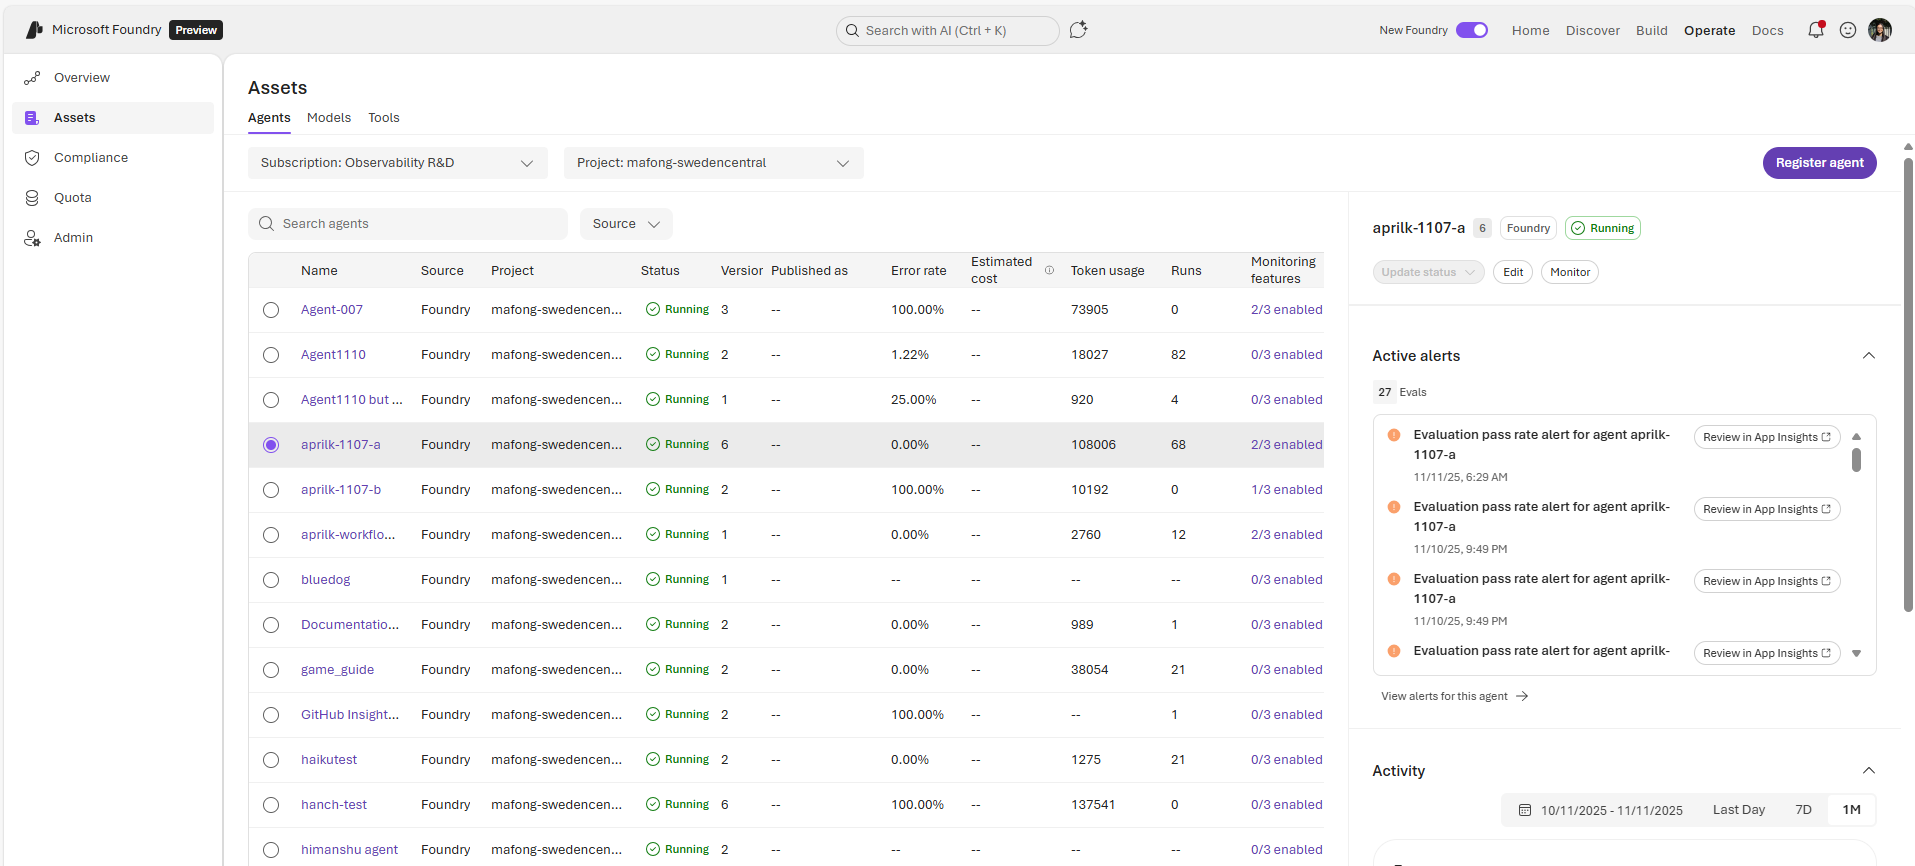
- Active alerts: View policy, security, and evaluation alerts grouped by severity and take action.
- Activity: See key metrics such as error rate over time, total run information, and information on token usage.
Troubleshoot monitoring
If you don’t see expected metrics or agents in the dashboard, check the following common causes:- Agents don’t appear in the Assets pane: Verify that you have read access to the subscription and project where the agents are deployed. Different users see different agents depending on their access level.
- Metrics are empty or missing: Confirm that the Application Insights resource is connected to the project (see Configure monitoring). Metrics can take several minutes to populate after the initial connection.
- Health metrics or traces aren’t available for a specific agent: The agent might be running on a resource without Application Insights configured. Connect an Application Insights resource to the agent’s project to enable health data and drill-down traces.
- Cost data doesn’t appear: Verify that you have the Cost Management Reader role on the subscription.