This feature is currently in public preview. This preview is provided without a service-level agreement, and we don’t recommend it for production workloads. Certain features might not be supported or might have constrained capabilities. For more information, see Supplemental Terms of Use for Microsoft Azure Previews.
Monitoring support is currently limited to Microsoft Foundry hubs. Foundry projects aren’t supported.To learn about Foundry hubs and projects, see What is Microsoft Foundry? and Migrate from hub-based to Foundry projects.
If you’re using a Foundry project, use Foundry monitoring instead of Azure Monitor metrics.See Monitor AI Agents with the Agent Monitoring Dashboard (preview).
Prerequisites
- An agent running in a standard agent setup.
- Access to the Azure resource you want to monitor. To view metrics, you need the Monitoring Reader role or equivalent permissions.
- To export metrics to Log Analytics or create alerts, you need the Monitoring Contributor role or equivalent permissions to create diagnostic settings and alert rules in your Azure subscription.
Dashboards
Foundry Agent Service provides out-of-the-box dashboards. There are two key dashboards to monitor your resource:- The metrics dashboard on the Foundry resource page.
- The dashboard in the overview pane in the Azure portal.
Data collection and routing in Azure Monitor
Azure Monitor collects platform metrics automatically for Azure resources. Platform metrics are stored in the Azure Monitor metrics database and are suitable for near real-time charts and metric alerts. If you want to query metrics in Log Analytics, build workbooks, export to external systems, or retain data longer, configure diagnostic settings to route metrics to other destinations. For more information, see Monitoring data from Azure resources and Create diagnostic settings to collect platform logs and metrics in Azure. Platform metrics are retained for 93 days by default. If you route metrics to Log Analytics, retention depends on your workspace configuration. Routing metrics to Log Analytics can increase costs. For more information, see Azure Monitor Logs cost calculations and options.Azure Monitor platform metrics
Azure Monitor provides platform metrics for most services. These metrics are:- Individually defined for each namespace.
- Stored in the Azure Monitor time-series metrics database.
- Lightweight and capable of supporting near real-time alerting.
- Used to track the performance of a resource over time.
- Collected automatically by Azure Monitor (no configuration required).
Agent Service metrics
Agent Service shares a subset of metrics with other Foundry components. The following metrics are currently available in Azure Monitor:| Metric | Name in REST API | Unit | Aggregation | Dimensions | Time grain |
|---|---|---|---|---|---|
| Agents | AgentEvents | Count | Average, Maximum, Minimum, Total (Sum) | EventType | PT1M |
| Indexed files | AgentIndexedFilesRead | Count | Average, Maximum, Minimum, Total (Sum) | ErrorCode, Status, VectorStoreId, AgentId | PT1M |
| Runs | AgentRuns | Count | Average, Maximum, Minimum, Total (Sum) | AgentId, RunStatus, StatusCode, StreamType, ThreadId | PT1M |
| Messages | AgentUserMessageEvents | Count | Average, Maximum, Minimum, Total (Sum) | EventType, AgentId, ThreadId | PT1M |
| Threads | AgentThreadEvents | Count | Average, Maximum, Minimum, Total (Sum) | AgentId, EventType | PT1M |
| Tokens | AgentTotalTokens | Count | Average, Maximum, Minimum, Total (Sum) | AgentId, ModelName, ModelVersion | PT1M |
| Tool calls | AgentToolCalls | Count | Average, Maximum, Minimum, Total (Sum) | AgentId, ToolName | PT1M |
Analyze monitoring data
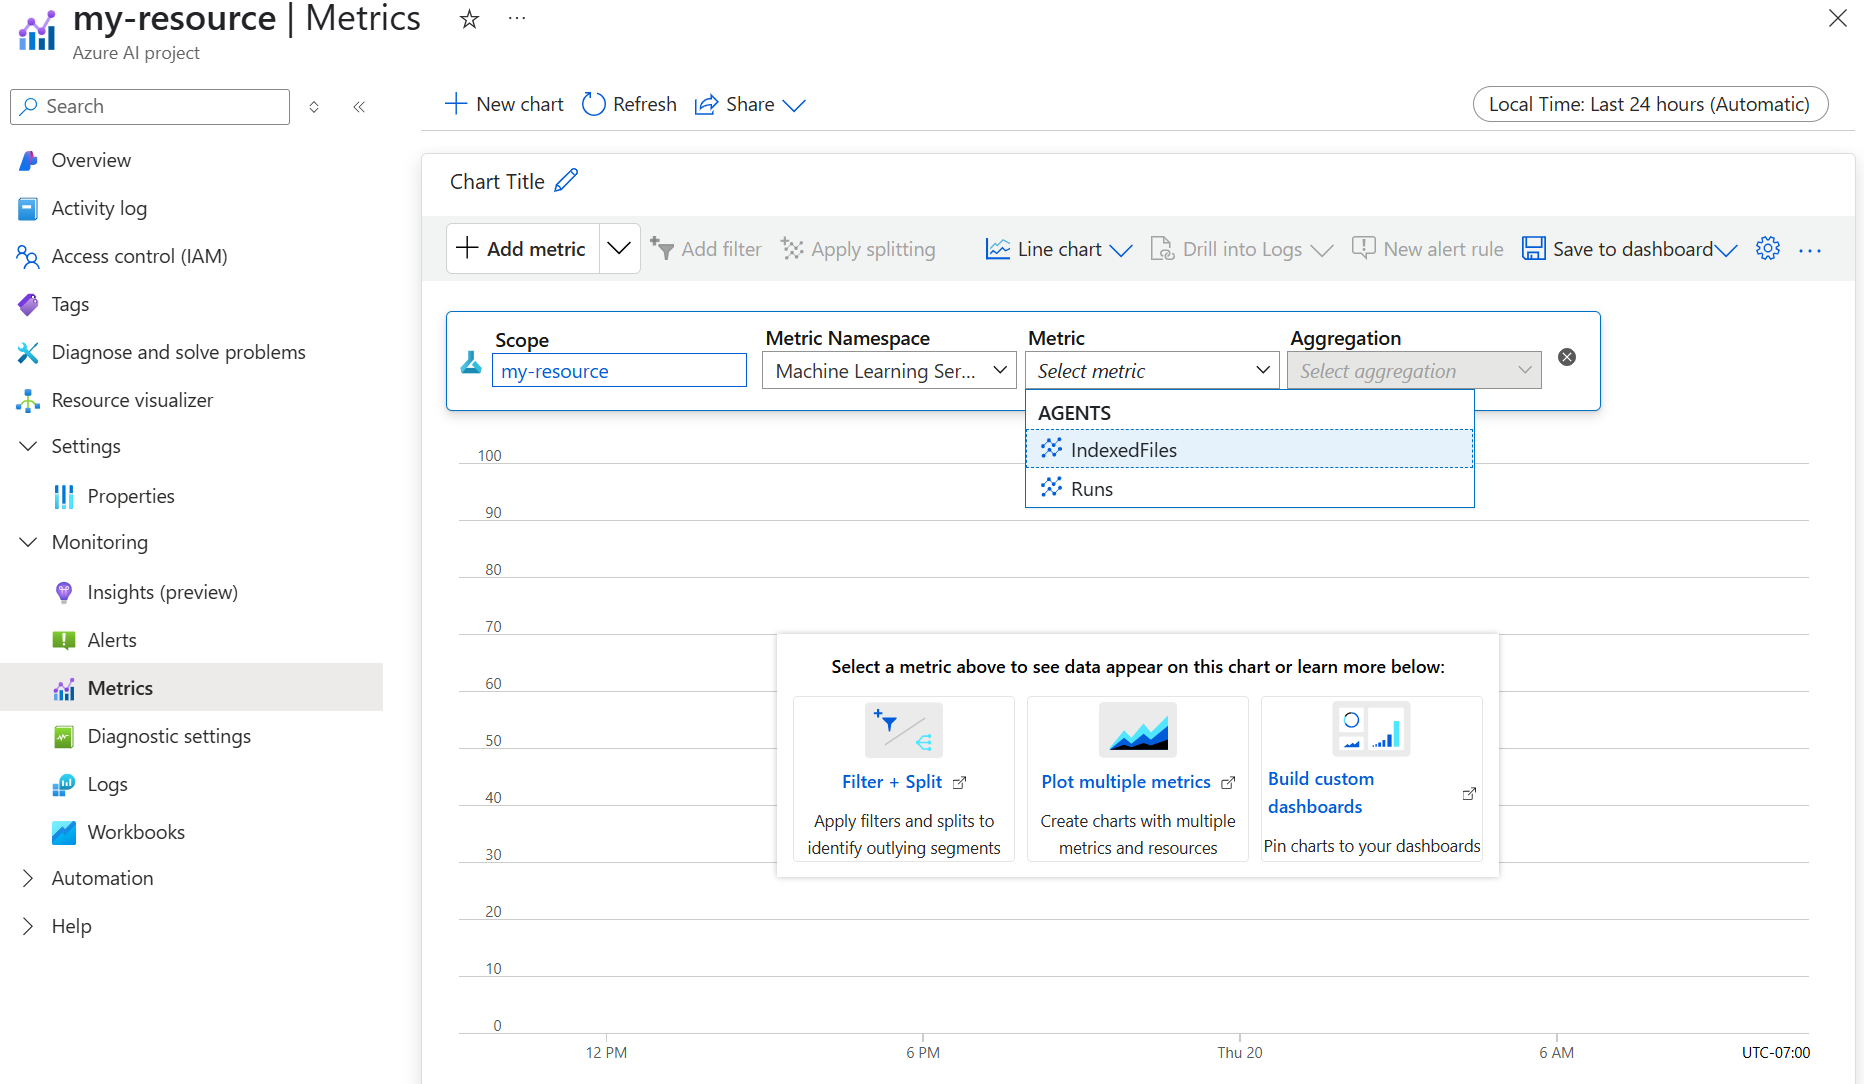
Use Metrics Explorer in the Azure portal
Azure Monitor supports Metrics Explorer, which lets you view and analyze metrics for Azure resources. Common analysis tasks include:- Filtering a chart by a dimension (for example, by
AgentId). - Splitting a chart by a dimension (for example, by
RunStatusorToolName). - Changing the time range and aggregation to match your investigation needs.
Verify you’re receiving metrics
If you don’t see data right away, confirm that metrics are flowing before you start deeper analysis:- Generate activity for your agent (for example, create a run and send a few messages).
- In Metrics Explorer, chart at least one metric (for example,
AgentRuns) for your Agent Service resource. - If you exported metrics to Log Analytics, wait a few minutes for ingestion, and then run a basic
AzureMetricsquery.
Export metrics with diagnostic settings
If you want to query metrics in Log Analytics or export them to other systems, configure diagnostic settings for the Agent Service resource and route metrics to one or more destinations. To configure diagnostic settings in the Azure portal:- In the Azure portal, open the Agent Service resource.
- Under Monitoring, select Diagnostic settings.
- Create a diagnostic setting and choose to export metrics to your destination (for example, a Log Analytics workspace).
- Save the diagnostic setting.
Query metrics with Log Analytics (KQL)
After you route metrics to a Log Analytics workspace, you can query them with KQL. The following query returns a sample of metric records:Create alerts
Azure Monitor alerts notify you when conditions are met in your monitoring data. For more information, see Alerts in Azure Monitor. To create a metric alert rule:- In the Azure portal, open the Agent Service resource.
- Select Monitoring > Alerts.
- Select Create > Alert rule.
- Under Condition, select a metric (for example,
AgentRuns). - If needed, use dimensions (for example,
RunStatusorStatusCode) to scope the alert. - Configure the action group, severity, and evaluation frequency.
- Select Create.
Troubleshooting
No data appears in Metrics Explorer
- Confirm you’re viewing the correct Agent Service resource.
- Expand the time range (for example, last 24 hours).
- Generate new activity (for example, create a run) and refresh the chart.
- Confirm you have permissions to view monitoring data for the resource.
No data appears in Log Analytics
- Confirm you created diagnostic settings for the Agent Service resource and selected the correct destination.
- Wait a few minutes for ingestion, and then rerun your query.
- Confirm you have permissions to query the Log Analytics workspace.
Next steps
- If you’re using a Foundry project, see Monitor AI Agents with the Agent Monitoring Dashboard (preview).
- For end-to-end debugging, see Trace and observe AI agents in Foundry (preview).
- For metric definitions, see Monitoring data reference.