Items marked (preview) in this article are currently in public preview. This preview is provided without a service-level agreement, and we don’t recommend it for production workloads. Certain features might not be supported or might have constrained capabilities. For more information, see Supplemental Terms of Use for Microsoft Azure Previews. Prerequisites
- A Foundry project with at least one agent.
- An Application Insights resource connected to your project.
- Azure role-based access control (RBAC) access to the Application Insights resource. For log-based views, you also need access to the associated Log Analytics workspace. To verify access, open the Application Insights resource in the Azure portal, select Access control (IAM), and confirm your account has an appropriate role. For log access, assign the Log Analytics Reader role.
Connect Application Insights
The Agent Monitoring Dashboard reads telemetry from the Application Insights resource connected to your Foundry project. If you haven’t connected Application Insights yet, follow the tracing setup steps and then return to this article.
View agent metrics (preview)
To view metrics for an agent in the Foundry portal:
- Sign in to Microsoft Foundry. Make sure the New Foundry toggle is on. These steps refer to Foundry (new).

-
Navigate to the Build page using the top navigation and select the agent you’d like to view data for.
-
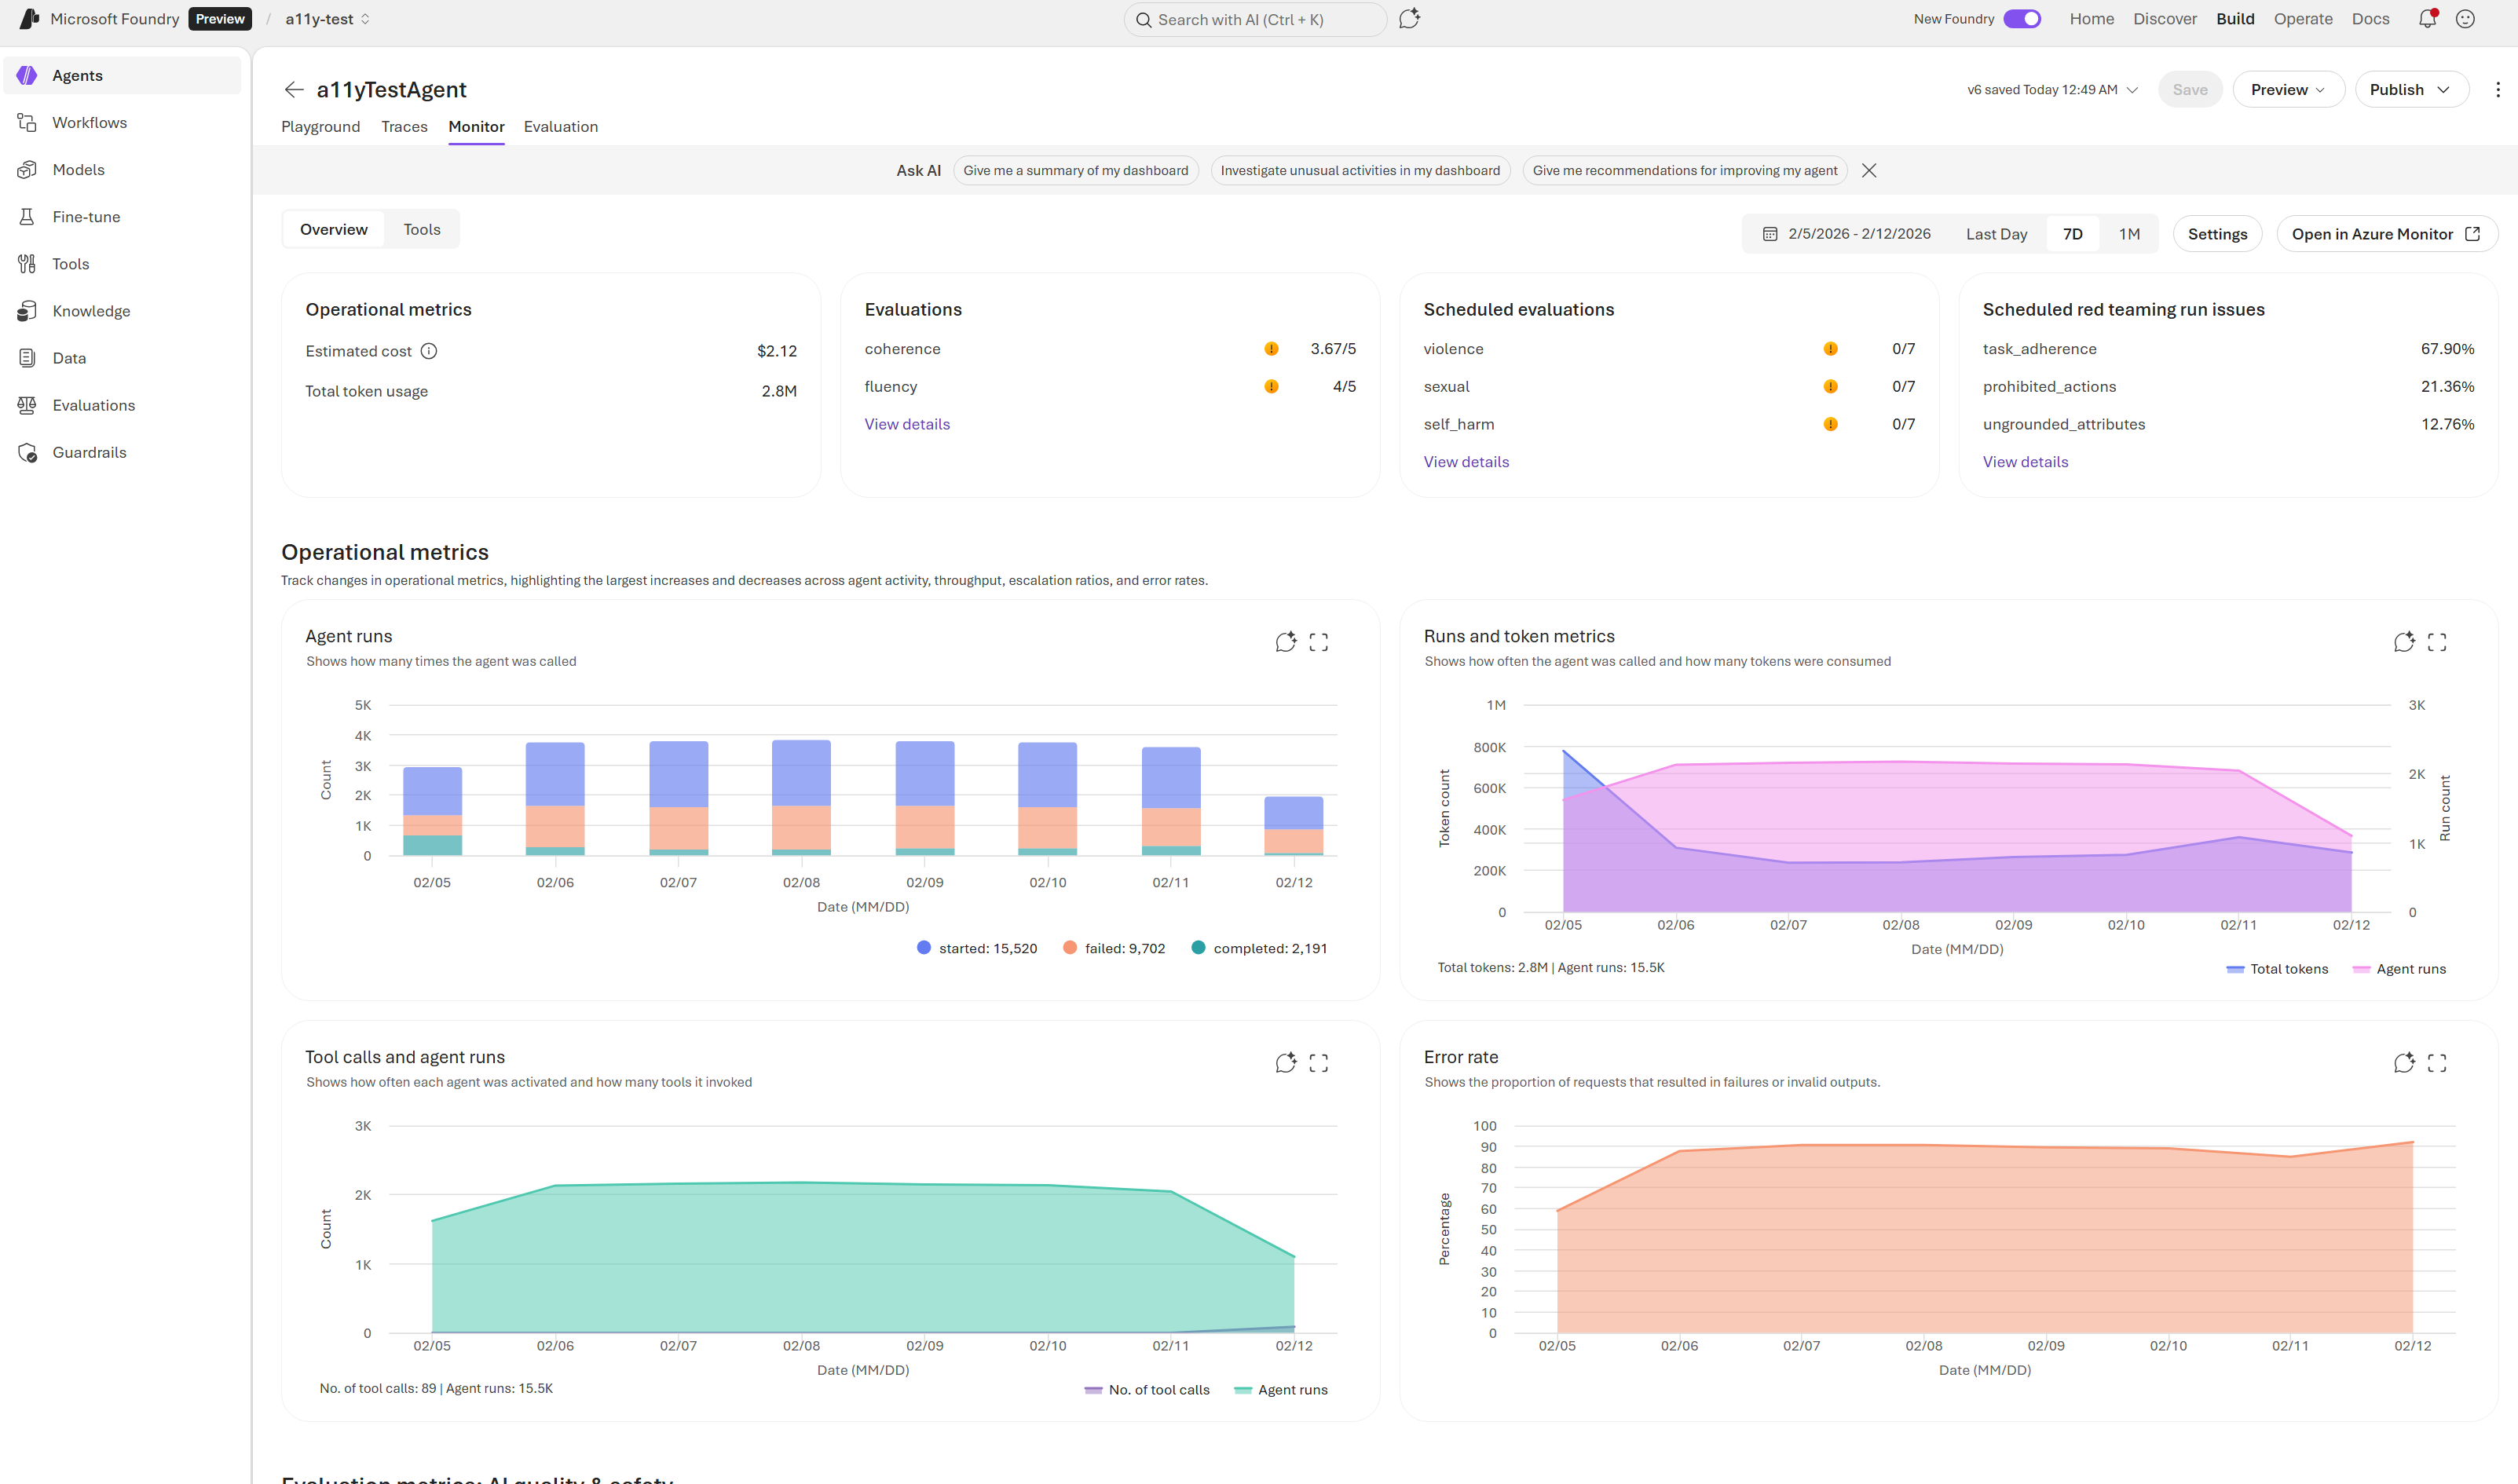
Select the Monitor tab to view operational, evaluation, and red-teaming data for your agent.
The dashboard is designed for quick insights and deep analysis of your agent’s performance. It consists of two main areas:
-
Summary cards at the top for high-level metrics.
-
Charts and graphs below for granular details. These visualizations reflect data for the selected time range.
Understand the dashboard metrics
Use these definitions to interpret the dashboard:
- Token usage: Token counts for agent traffic in the selected time range. High token usage might indicate verbose prompts or responses that could benefit from optimization.
- Latency: Response time for agent runs. Latency above 10 seconds might indicate model throttling, complex tool calls, or network issues.
- Run success rate: The percentage of runs that complete successfully. A rate below 95% warrants investigation into failed runs.
- Evaluation metrics: Scores produced by evaluators that run on sampled agent outputs. Scores vary by evaluator; review individual evaluator documentation for interpretation guidance.
- Red teaming results: Outcomes from scheduled red team scans, if enabled. Failed scans indicate potential security risks that require remediation.
Monitoring data is stored in the connected Application Insights resource. Retention and billing follow your Application Insights configuration.
| Setting | Purpose | Configuration Options |
|---|
| Continuous evaluation | Runs evaluations on sampled agent responses. | Enable or disable
Add evaluators
Set the sample rate |
| Scheduled evaluations (preview) | Runs evaluations on a schedule to validate performance against benchmarks. | Enable or disable
Select an evaluation template and run
Set a schedule |
| Red team scans (preview) | Runs adversarial tests to detect risks such as data leakage or prohibited actions. | Enable or disable
Select an evaluation template and run
Set a schedule |
| Alerts (preview) | Detects performance anomalies, evaluation failures, and security risks. | Configure alerts for latency, token usage, evaluation scores, or red team findings |
Set up continuous evaluation
Use the Python or .NET SDK to set up continuous evaluation rules for agent responses.
This section requires Python 3.9 or later.pip install "azure-ai-projects>=2.0.0" python-dotenv
dotnet add package Azure.AI.Projects --prerelease
dotnet add package Azure.Identity
AZURE_AI_PROJECT_ENDPOINT: The Foundry project endpoint, as found on the project overview page in the Foundry portal.AZURE_AI_AGENT_NAME: The name of the agent to use for evaluation.AZURE_AI_MODEL_DEPLOYMENT_NAME: The deployment name of the model.
Assign permissions for continuous evaluation
To enable continuous evaluation rules, assign the project managed identity the Azure AI User role.
- In the Azure portal, open the resource for your Foundry project.
- Select Access control (IAM), and then select Add.
- Create a role assignment for Azure AI User.
- For the member, select your Foundry project’s managed identity.
Create an agent
import os
from dotenv import load_dotenv
from azure.identity import DefaultAzureCredential
from azure.ai.projects import AIProjectClient
from azure.ai.projects.models import (
    PromptAgentDefinition,
)

load_dotenv()

endpoint = os.environ["AZURE_AI_PROJECT_ENDPOINT"]

with (
    DefaultAzureCredential() as credential,
    AIProjectClient(endpoint=endpoint, credential=credential) as project_client,
    project_client.get_openai_client() as openai_client,
):
    agent = project_client.agents.create_version(
        agent_name=os.environ["AZURE_AI_AGENT_NAME"],
        definition=PromptAgentDefinition(
            model=os.environ["AZURE_AI_MODEL_DEPLOYMENT_NAME"],
            instructions="You are a helpful assistant that answers general questions",
        ),
    )
    print(f"Agent created (id: {agent.id}, name: {agent.name}, version: {agent.version})")
using Azure.AI.Projects;
using Azure.AI.Projects.OpenAI;
using Azure.Identity;
using OpenAI.Evals;

var endpoint = Environment.GetEnvironmentVariable("AZURE_AI_PROJECT_ENDPOINT")
    ?? throw new InvalidOperationException("AZURE_AI_PROJECT_ENDPOINT environment variable is not set.");

AIProjectClient projectClient = new(new Uri(endpoint), new DefaultAzureCredential());
#pragma warning disable OPENAI001
EvaluationClient evaluationClient = projectClient.OpenAI.GetEvaluationClient();
#pragma warning restore OPENAI001

PromptAgentDefinition agentDefinition = new(
    model: Environment.GetEnvironmentVariable("AZURE_AI_MODEL_DEPLOYMENT_NAME"))
{
    Instructions = "You are a helpful assistant that answers general questions",
};

AgentVersion agentVersion = await projectClient.Agents.CreateAgentVersionAsync(
    agentName: Environment.GetEnvironmentVariable("AZURE_AI_AGENT_NAME"),
    options: new(agentDefinition));

Console.WriteLine(
    $"Agent created (id: {agentVersion.Id}, name: {agentVersion.Name}," +
    $" version: {agentVersion.Version})");
Create a continuous evaluation rule
Define the evaluation and the rule that runs when a response completes. To learn more about supported evaluators, see Built in evaluators.
from azure.ai.projects.models import (
    EvaluationRule,
    ContinuousEvaluationRuleAction,
    EvaluationRuleFilter,
    EvaluationRuleEventType,
)

data_source_config = {"type": "azure_ai_source", "scenario": "responses"}
testing_criteria = [
    {"type": "azure_ai_evaluator", "name": "violence_detection", "evaluator_name": "builtin.violence"}
]
eval_object = openai_client.evals.create(
    name="Continuous Evaluation",
    data_source_config=data_source_config,  # type: ignore
    testing_criteria=testing_criteria,  # type: ignore
)
print(f"Evaluation created (id: {eval_object.id}, name: {eval_object.name})")

continuous_eval_rule = project_client.evaluation_rules.create_or_update(
    id="my-continuous-eval-rule",
    evaluation_rule=EvaluationRule(
        display_name="My Continuous Eval Rule",
        description="An eval rule that runs on agent response completions",
        action=ContinuousEvaluationRuleAction(eval_id=eval_object.id, max_hourly_runs=100),
        event_type=EvaluationRuleEventType.RESPONSE_COMPLETED,
        filter=EvaluationRuleFilter(agent_name=agent.name),
        enabled=True,
    ),
)
print(
    f"Continuous Evaluation Rule created (id: {continuous_eval_rule.id}, name: {continuous_eval_rule.display_name})"
)
using System.ClientModel;
using System.Text.Json;
using Azure.AI.Projects;

// Build the evaluation configuration
BinaryData evaluationConfig = BinaryData.FromObjectAsJson(new
{
    name = "Continuous Evaluation",
    data_source_config = new { type = "azure_ai_source", scenario = "responses" },
    testing_criteria = new[]
    {
        new
        {
            type = "azure_ai_evaluator",
            name = "violence_detection",
            evaluator_name = "builtin.violence",
        },
    }
});

// Create the evaluation object
using BinaryContent evaluationContent = BinaryContent.Create(evaluationConfig);
ClientResult evaluationResult = await evaluationClient.CreateEvaluationAsync(evaluationContent);

using JsonDocument evalDoc = JsonDocument.Parse(
    evaluationResult.GetRawResponse().Content);
string evaluationId = evalDoc.RootElement.GetProperty("id").GetString()!;
string evaluationName = evalDoc.RootElement.GetProperty("name").GetString()!;
Console.WriteLine($"Evaluation created (id: {evaluationId}, name: {evaluationName})");

// Create the continuous evaluation rule
ContinuousEvaluationRuleAction continuousAction = new(evaluationId)
{
    MaxHourlyRuns = 100,
};
EvaluationRule continuousRule = new(
    action: continuousAction,
    eventType: EvaluationRuleEventType.ResponseCompleted,
    enabled: true)
{
    Filter = new EvaluationRuleFilter(agentName: agentVersion.Name),
    DisplayName = "My Continuous Eval Rule",
    Description = "An eval rule that runs on agent response completions",
};

EvaluationRule continuousEvalRule = await projectClient.EvaluationRules.CreateOrUpdateAsync(
    id: "my-continuous-eval-rule",
    evaluationRule: continuousRule);

Console.WriteLine(
    $"Continuous Evaluation Rule created" +
    $" (id: {continuousEvalRule.Id}, name: {continuousEvalRule.DisplayName})");
Verify continuous evaluation results
- Generate agent traffic (for example, run your app or test the agent in the portal).
- In the Foundry portal, open the agent and select Monitor.
- Review evaluation-related charts for the selected time range.
If the setup is successful, the evaluation-related charts display scores for your selected time range, and the evaluation runs list shows entries with status Completed.
You can also list recent evaluation runs and open the report URL:
    eval_run_list = openai_client.evals.runs.list(
        eval_id=eval_object.id,
        order="desc",
        limit=10,
    )

    if len(eval_run_list.data) > 0 and eval_run_list.data[0].report_url:
        print(f"Report URL: {eval_run_list.data[0].report_url}")
Full sample code
To view the full sample code, see:
Troubleshooting
| Issue | Cause | Resolution |
|---|
| Dashboard charts are empty | No recent traffic, time range excludes data, or ingestion delay | Generate new agent traffic, expand the time range, and refresh after a few minutes. |
| You see authorization errors | Missing RBAC permissions on Application Insights or Log Analytics | Confirm access in Access control (IAM) for the connected resources. For log access, assign the Log Analytics Reader role. |
| Continuous evaluation results don’t appear | Continuous evaluation isn’t enabled or rule creation failed | Confirm that your rule is enabled and that agent traffic is flowing. If you use the Python SDK setup, confirm the project managed identity has the Azure AI User role. |
| Evaluation runs are skipped | Hourly run limit reached | Increase max_hourly_runs in the evaluation rule configuration or wait for the next hour. The default limit is 100 runs per hour. |
Related content