Items marked (preview) in this article are currently in public preview. This preview is provided without a service-level agreement, and we don’t recommend it for production workloads. Certain features might not be supported or might have constrained capabilities. For more information, see Supplemental Terms of Use for Microsoft Azure Previews.
Prerequisites
To use monitoring capabilities for model deployments in Foundry Models, you need the following:- At least one model deployment.
- To view metrics: at least the user needs the Monitoring Reader role on the resource.
- To configure diagnostic settings: the user needs the Monitoring Contributor role (or equivalent) on the resource.
Metrics
Azure Monitor collects metrics from Foundry Models automatically. No configuration is required. These metrics are:- Stored in the Azure Monitor time-series metrics database.
- Lightweight and capable of supporting near real-time alerting.
- Used to track the performance of a resource over time.
View metrics
Azure Monitor metrics can be queried using multiple tools, including:Foundry portal
You can view metrics within the Foundry portal. To view them, follow these steps:- Go to the Foundry portal.
- Under My assets in the sidebar menu, select Models + endpoints, and then select the name of the deployment you want to see metrics about.
- Select the Metrics tab.
- You can access an overview of common metrics that might be of interest. For cost-related metrics, select the Azure Cost Management link, which provides access to detailed post-consumption cost metrics in the Cost analysis section located in the Azure portal.
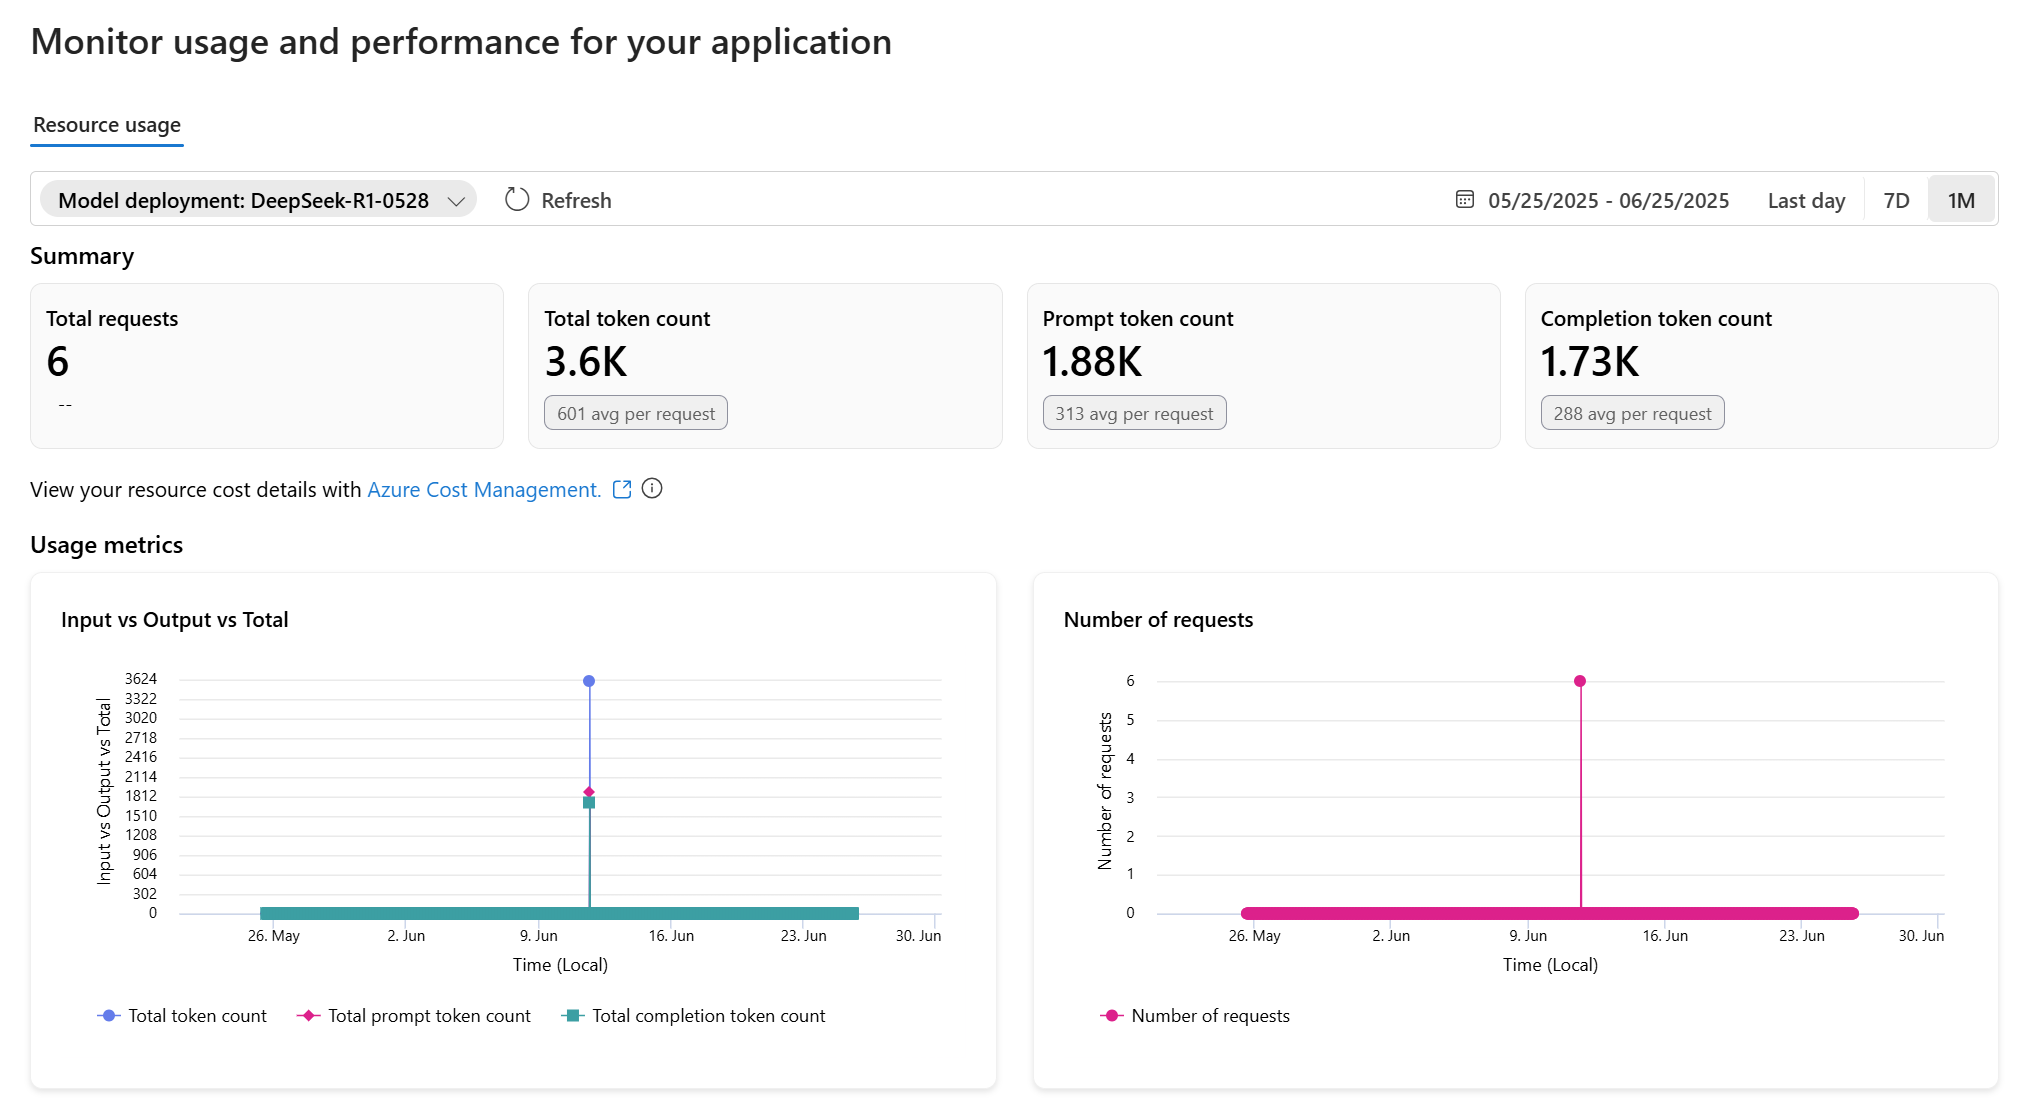
The Azure Cost Management link provides a direct link within the Azure portal, allowing users to access detailed cost metrics for deployed AI models. This deep link integrates with the Azure Cost Analysis service view, offering transparent and actionable insights into model-level costs.The deep link directs users to the Cost Analysis view in the Azure portal, providing a one-click experience to view deployments per resource, including input/output token cost/consumption. To view cost data, you need at least read access for an Azure account. For information about assigning access to Cost Management data, see Assign access to data.
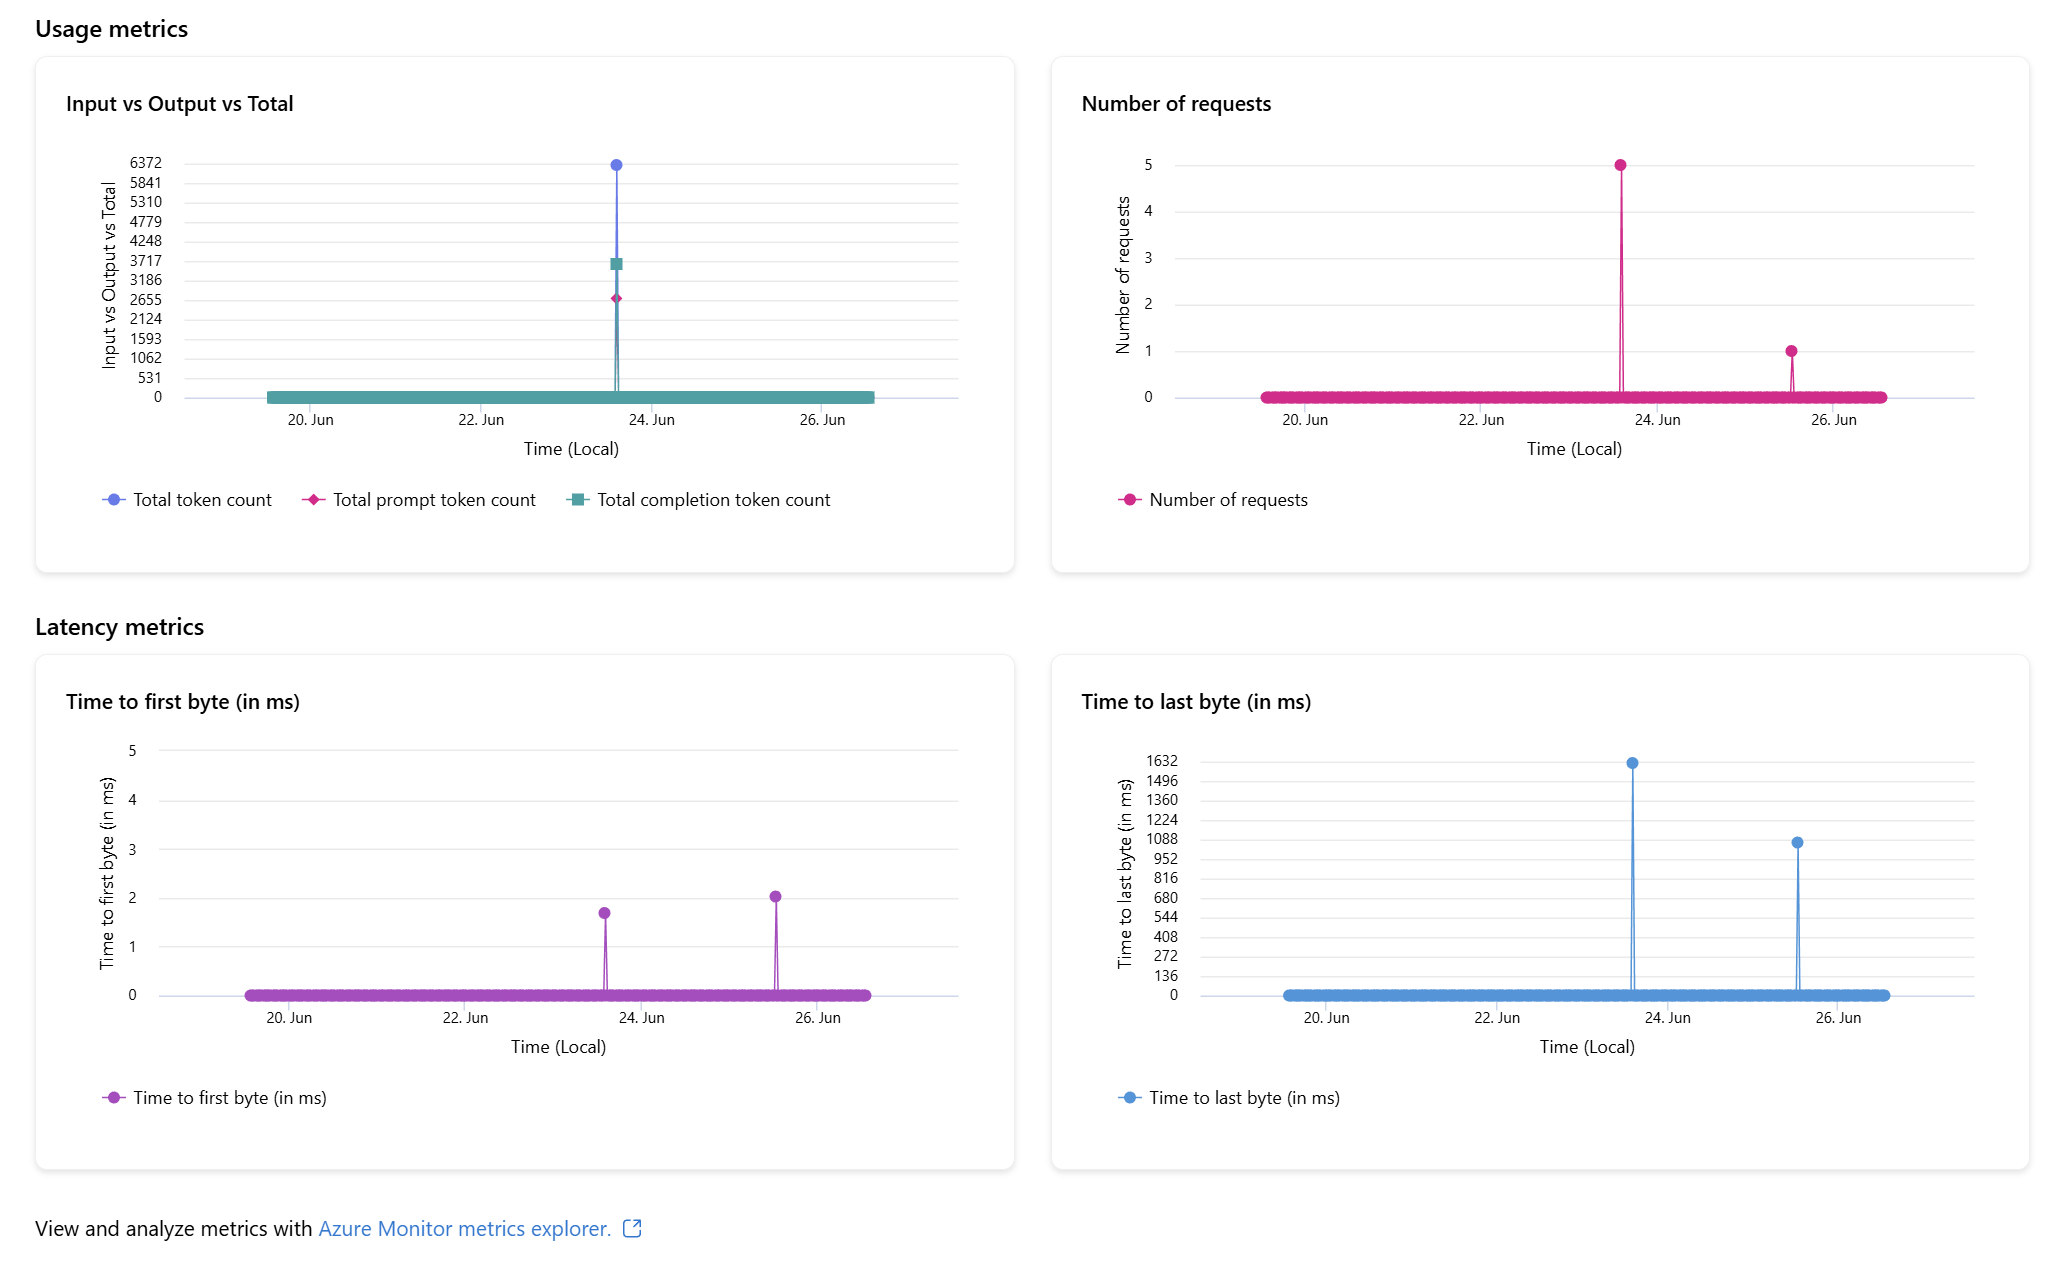
- You can view and analyze metrics with Azure Monitor metrics explorer to further slice and filter your model deployment metrics.
Metrics explorer
Metrics explorer is a tool in the Azure portal that allows you to view and analyze metrics for Azure resources. For more information, see Analyze metrics with Azure Monitor metrics explorer. To use Azure Monitor, follow these steps:- Go to the Azure portal.
- Type and select Monitor on the search box.
- Select Metrics in the sidebar menu.
- On Select scope, select the resources you want to monitor. You can either select one resource or select a resource group or subscription. If that’s the case, ensure you select Resource types as Foundry Tools.
- The metrics explorer appears. Select the metrics that you want to explore. The following example shows the number of requests made to the model deployments in the resource.
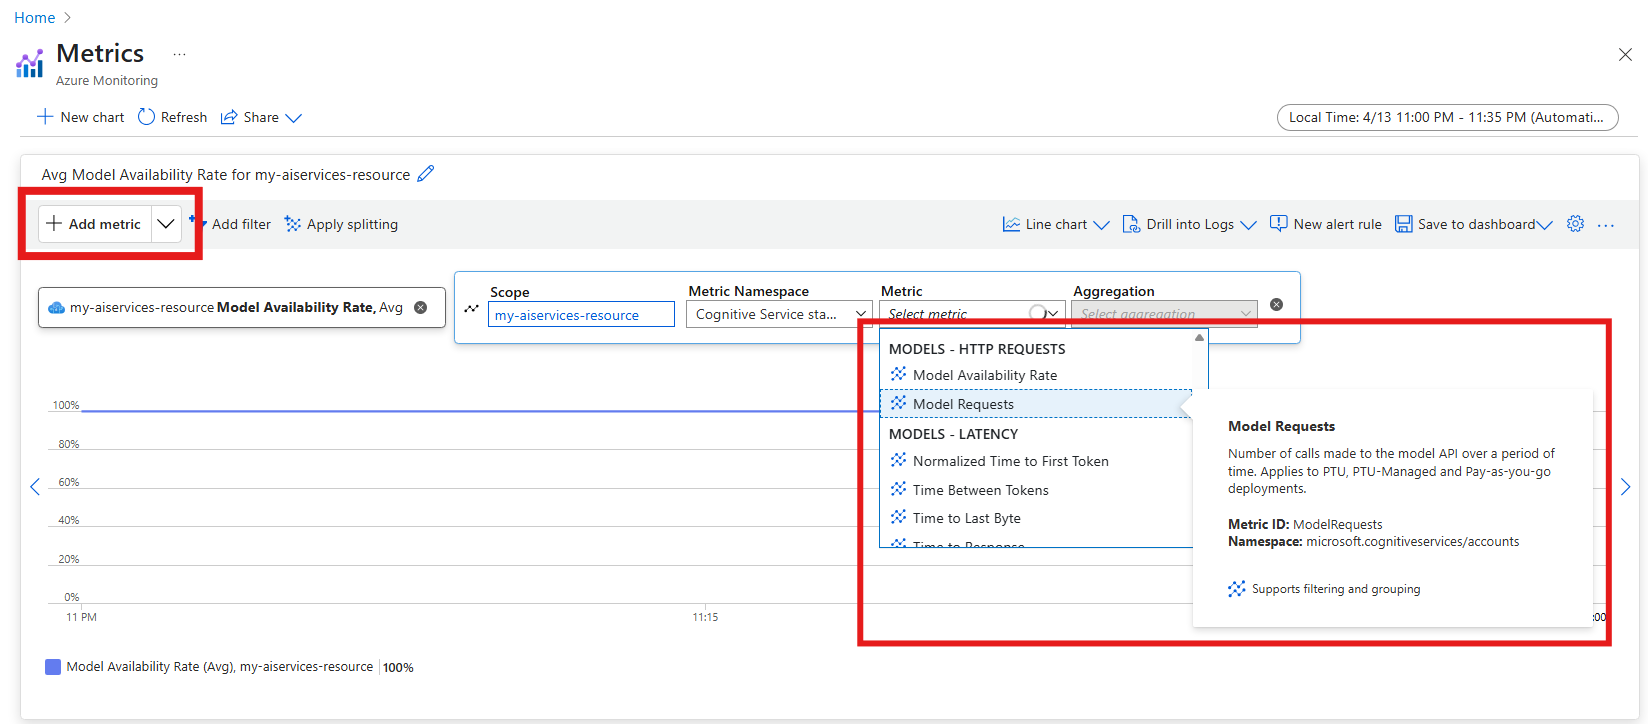
Metrics in the Azure OpenAI category contain metrics for Azure OpenAI models in the resource. The Models category contains all the models available in the resource, including Azure OpenAI, DeepSeek, and Phi. We recommend switching to this new set of metrics.
- You can add as many metrics as needed to either the same chart or to a new chart.
- If you need, you can filter metrics by any of their available dimensions.
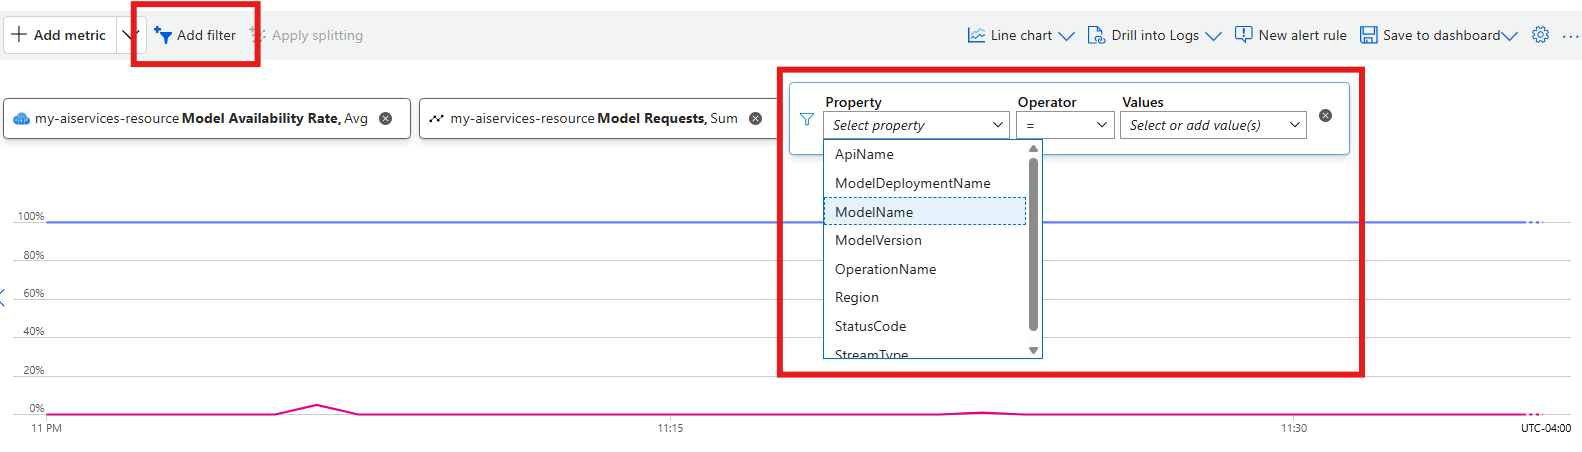
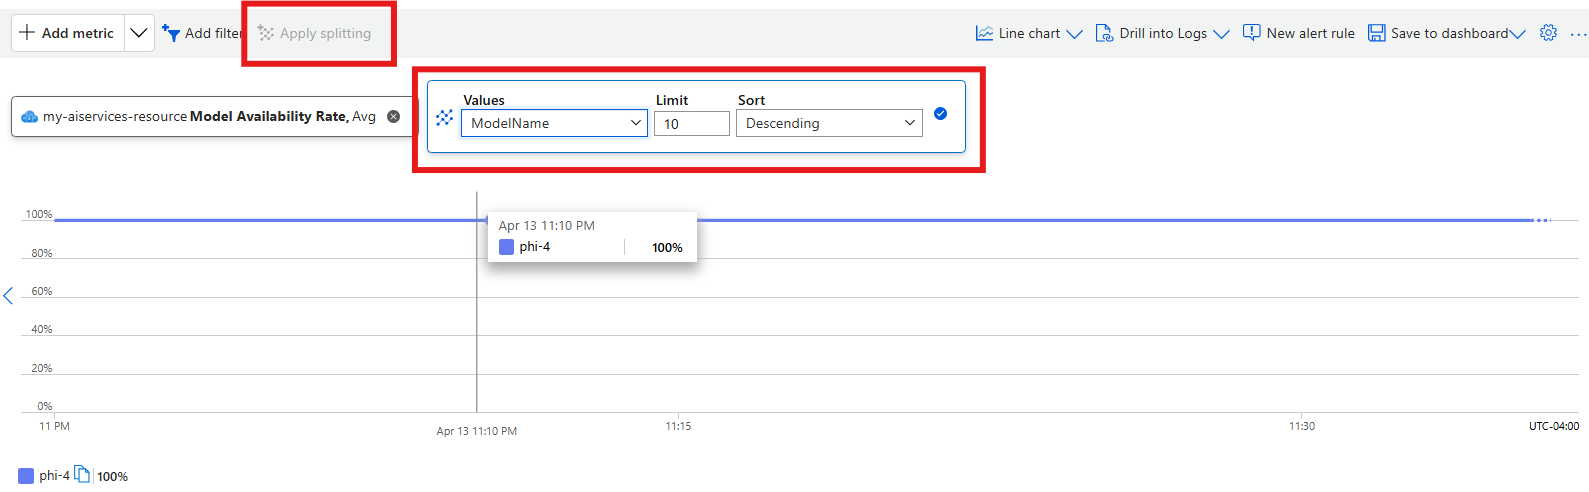
- It’s useful to break down specific metrics by some of the dimensions. The following example shows how to break down the number of requests made to the resource by model by using the option Add splitting:
- You can save your dashboards at any time to avoid having to configure them each time.
Other tools
Tools that allow more complex visualization include:- Workbooks: customizable reports that you can create in the Azure portal. Workbooks can include text, metrics, and log queries.
- Grafana: an open platform tool that excels in operational dashboards. You can use Grafana to create dashboards that include data from multiple sources other than Azure Monitor.
- Power BI: a business analytics service that provides interactive visualizations across various data sources. You can configure Power BI to automatically import log data from Azure Monitor to take advantage of these visualizations.
Metrics reference
The following categories of metrics are available:Models - Requests
| Metric | Internal name | Unit | Aggregation | Dimensions |
|---|---|---|---|---|
| Model Availability Rate Availability percentage with the following calculation: (Total Calls - Server Errors)/Total Calls. Server Errors include any HTTP responses >=500. | ModelAvailabilityRate | Percent | Minimum, Maximum, Average | ApiName, OperationName, Region, StreamType, ModelDeploymentName, ModelName, ModelVersion |
| Model Requests Number of calls made to the model inference API over a period of time. | ModelRequests | Count | Total (Sum) | ApiName, OperationName, Region, StreamType, ModelDeploymentName, ModelName, ModelVersion, StatusCode |
Models - Latency
| Metric | Internal name | Unit | Aggregation | Dimensions |
|---|---|---|---|---|
| Time To Response Recommended latency (responsiveness) measure for streaming requests. Applies to PTU and PTU-managed deployments. Calculated as time taken for the first response to appear after a user sends a prompt, as measured by the API gateway. This number increases as the prompt size increases and/or cache hit size reduces. This metric is an approximation because measured latency depends on multiple factors, including concurrent calls and overall workload pattern. It doesn’t account for any client-side latency between your client and the API endpoint. Refer to your own logging for optimal latency tracking. | TimeToResponse | Milliseconds | Maximum, Minimum, Average | ApiName, OperationName, Region, StreamType, ModelDeploymentName, ModelName, ModelVersion, StatusCode |
| Normalized Time Between Tokens For streaming requests; model token generation rate, measured in milliseconds. Applies to PTU and PTU-managed deployments. | NormalizedTimeBetweenTokens | Milliseconds | Maximum, Minimum, Average | ApiName, OperationName, Region, StreamType, ModelDeploymentName, ModelName, ModelVersion |
Models - Usage
| Metric | Internal name | Unit | Aggregation | Dimensions |
|---|---|---|---|---|
| Input Tokens Number of prompt tokens processed (input) on a model. Applies to PTU, PTU-managed and standard deployments. | InputTokens | Count | Total (Sum) | ApiName, Region, ModelDeploymentName, ModelName, ModelVersion |
| Output Tokens Number of tokens generated (output) from a model. Applies to PTU, PTU-managed and standard deployments. | OutputTokens | Count | Total (Sum) | ApiName, Region, ModelDeploymentName, ModelName, ModelVersion |
| Total Tokens Number of inference tokens processed on a model. Calculated as prompt tokens (input) plus generated tokens (output). Applies to PTU, PTU-managed and standard deployments. | TotalTokens | Count | Total (Sum) | ApiName, Region, ModelDeploymentName, ModelName, ModelVersion |
| Tokens Cache Match Rate Percentage of prompt tokens that hit the cache. Applies to PTU and PTU-managed deployments. | TokensCacheMatchRate | Percentage | Average | Region, ModelDeploymentName, ModelName, ModelVersion |
| Provisioned Utilization Utilization percentage for a provisioned-managed deployment, calculated as (PTUs consumed / PTUs deployed) x 100. When utilization is greater than or equal to 100%, calls are throttled and error code 429 is returned. | ProvisionedUtilization | Percentage | Average | Region, ModelDeploymentName, ModelName, ModelVersion |
| Provisioned Consumed Tokens Total tokens minus cached tokens over a period of time. Applies to PTU and PTU-managed deployments. | ProvisionedConsumedTokens | Count | Total (Sum) | Region, ModelDeploymentName, ModelName, ModelVersion |
| Audio Input Tokens Number of audio prompt tokens processed (input) on a model. Applies to PTU-managed model deployments. | AudioInputTokens | Count | Total (Sum) | Region, ModelDeploymentName, ModelName, ModelVersion |
| Audio Output Tokens Number of audio prompt tokens generated (output) on a model. Applies to PTU-managed model deployments. | AudioOutputTokens | Count | Total (Sum) | Region, ModelDeploymentName, ModelName, ModelVersion |
Logs
Resource logs provide insight into operations that were done by an Azure resource. Logs are generated automatically, but you must route them to Azure Monitor logs to save or query by configuring a diagnostic setting. Logs are organized in categories. When you create a diagnostic setting, you specify which categories of logs to collect. The following log categories are available for Foundry Models:| Category | Description |
|---|---|
| RequestResponse | Logs for every inference request and response, including status codes and latency. |
| Trace | Detailed trace logs for debugging model inference calls. |
| Audit | Administrative operations such as deployments, configuration changes, and access control events. |
Configure diagnostic settings
All of the metrics are exportable with diagnostic settings in Azure Monitor. To analyze logs and metrics data with Azure Monitor Log Analytics queries, you can configure diagnostic settings for your Foundry Tools resource. Perform this operation on each resource.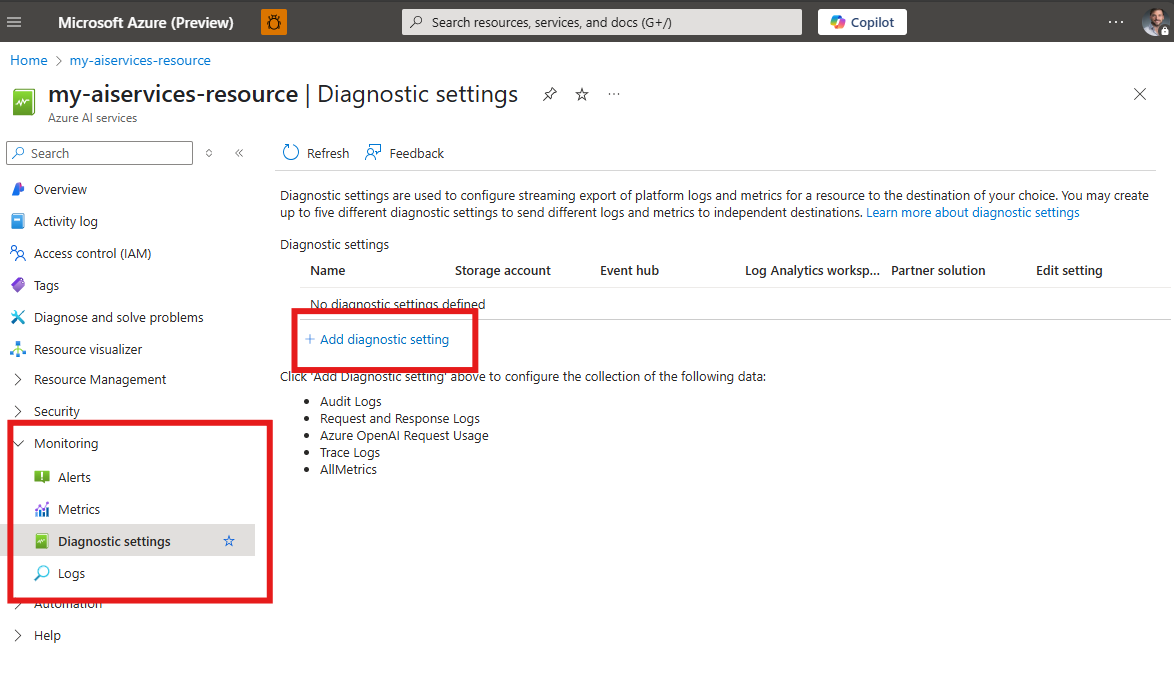
- Go to the Azure portal and locate your Foundry resource.
- Under Monitoring in the sidebar menu, select Diagnostic settings.
- Select Add diagnostic setting.
- Enter a name for the diagnostic setting.
- Under Logs, select the log categories you want to collect (for example, RequestResponseLogs).
- Under Metrics, select AllMetrics to export metrics.
- Under Destination details, select Send to Log Analytics workspace and choose a workspace in your subscription.
- Select Save.
There’s a cost for collecting data in a Log Analytics workspace, so only collect the categories you require for each service. The data volume for resource logs varies significantly between services.
Query logs with KQL
After you configure diagnostic settings to send metrics to Log Analytics, you can query and analyze log data by using the Kusto query language (KQL). To query metrics, follow these steps:- Go to the Azure portal.
- Locate the Foundry resource you want to query.
- Under Monitoring in the sidebar menu, select Logs. If the query window options populate, close the window.
- A new query tab will populate. Select the Sample mode drop-down and select KQL mode.
-
To examine the Azure Metrics, type a custom query or copy and paste the following query:
- Select Run
When you select Monitoring > Logs in the menu for your resource, Log Analytics opens with the query scope set to the current resource. The visible log queries include data from that specific resource only. To run a query that includes data from other resources or data from other Azure services, select Logs from the Azure Monitor menu in the Azure portal. For more information, see Log query scope and time range in Azure Monitor Log Analytics.
Troubleshooting
| Issue | Possible cause | Resolution |
|---|---|---|
| Metrics not appearing in metrics explorer | The resource type filter might not be set correctly. | Ensure Resource types is set to Foundry Tools in the scope selector. |
| No log data in Log Analytics | Diagnostic settings aren’t configured, or data hasn’t arrived yet. | Configure diagnostic settings and wait up to 15 minutes for data to appear. |
| Metrics show zero values | The model deployment might not have received traffic in the selected time range. | Adjust the time range in metrics explorer, or verify the deployment is receiving requests. |
| Cost data not visible in Microsoft Cost Management | Missing permissions or billing delay. | Ensure you have at least read access to the Azure account. Cost data can take up to five hours to appear. |
| 429 errors on model calls | Provisioned utilization is at or above 100%. | Check the Provisioned Utilization metric and scale up PTUs, or reduce request volume. |