In this article, you learn how to:
- Locate and open evaluation runs.
- View aggregate and sample-level metrics.
- Compare results across runs.
- Interpret metric categories and calculations.
- Troubleshoot missing or partial metrics.
Prerequisites
The Foundry RBAC roles were recently renamed. Foundry User, Foundry Owner, Foundry Account Owner, and Foundry Project Manager were previously named Azure AI User, Azure AI Owner, Azure AI Account Owner, and Azure AI Project Manager. You might still see the previous names in some places while the rename rolls out. The role IDs and core permissions are unchanged by the rename.
- A completed evaluation run.
See your evaluation results
-
In the Foundry portal, go to your project and select Evaluation from the left pane.
-
Select an evaluation run from the list to open its details page. If the run is still in progress, the status shows Running and updates automatically when complete.
The details page shows:
| Field | Description |
|---|
| Name | The name of the evaluation run. |
| Target | The model or agent that was evaluated. |
| Dataset | The test dataset used. Select the download icon to export it as a CSV file. |
| Status | Current status of the run (Running, Completed, or Failed). |
| Evaluation tokens | Tokens consumed by the evaluators during the run. |
| Target tokens | Tokens consumed by the model or agent being evaluated. |
| Scores | Aggregate score for each evaluator used. |
- Hover over a score cell to see token usage details and additional context.
- Select Learn more about metrics to see metric definitions and scoring formulas.
Evaluation run details
Select the name of the run to view row-level results for each individual query. For each row, you can see the query, response, ground truth, evaluator score, and score explanation.
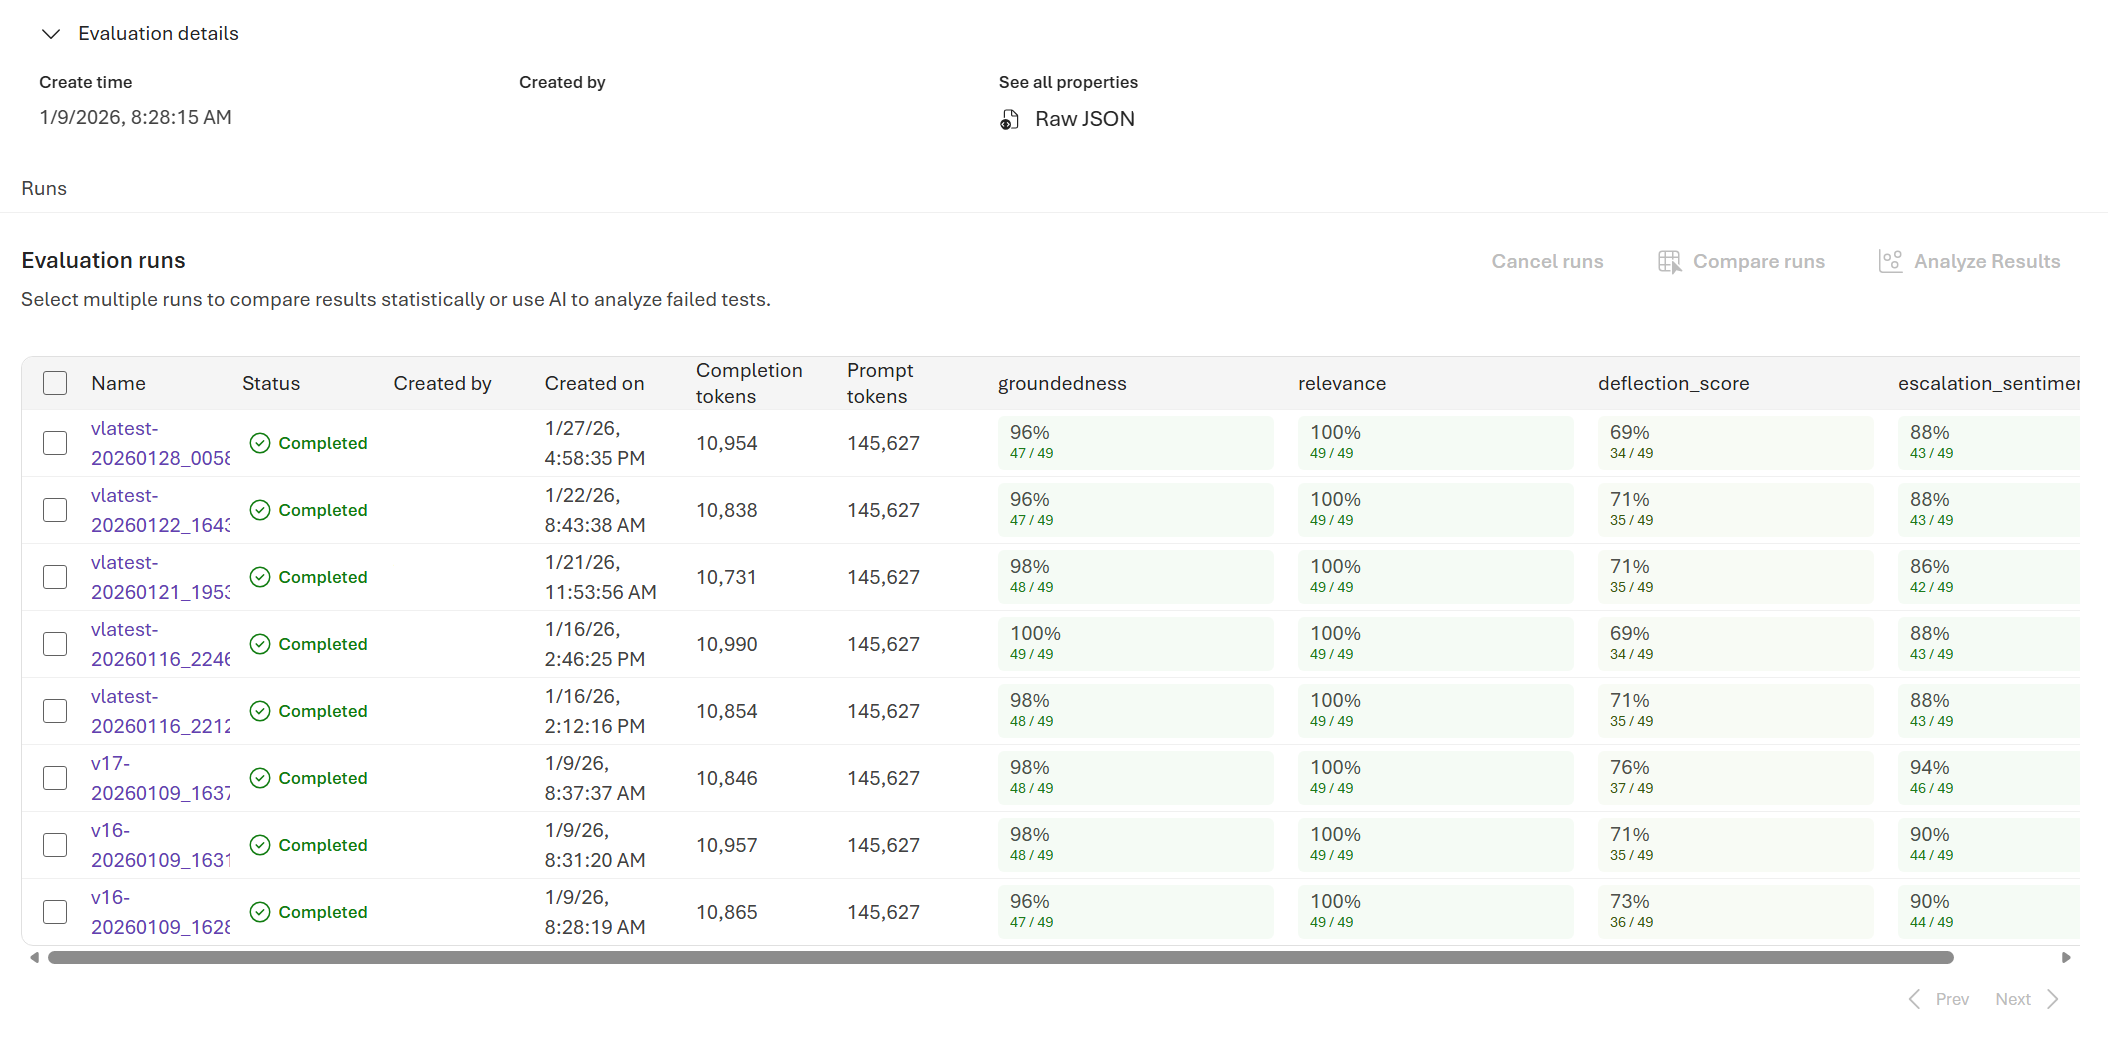
Compare the evaluation results
To compare two or more runs, select the runs you want to compare and start the process.
- Select two or more runs in the evaluation detail page.
- Select Compare.
You see a side-by-side comparison view for all selected runs.
The comparison uses statistical t-testing, which gives you more sensitive and reliable results to help you make decisions. You can use different functionalities of this feature:
- Baseline comparison: By setting a baseline run, you can identify a reference point against which to compare the other runs. You can see how each run deviates from your chosen standard.
- Statistical t-testing assessment: Each cell provides the stat-sig results with different color codes. You can also hover on the cell to get the sample size and p-value.
| Legend | Definition |
|---|
| ImprovedStrong | Highly stat-sig (p<=0.001) and moved in the desired direction |
| ImprovedWeak | Stat-sig (0.001<p<=0.05) and moved in the desired direction |
| DegradedStrong | Highly stat-sig (p<=0.001) and moved in the wrong direction |
| DegradedWeak | Stat-sig (0.001<p<=0.05) and moved in the wrong direction |
| ChangedStrong | Highly stat-sig (p<=0.001) and desired direction is neutral |
| ChangedWeak | Stat-sig (0.001<p<=0.05) and desired direction is neutral |
| Inconclusive | Too few examples, or p>=0.05 |
The comparison view isn’t saved. If you leave the page, you can reselect the runs and select Compare to regenerate the view.
Understand the built-in evaluation metrics
Understanding the built-in metrics is essential for assessing the performance and effectiveness of your AI application. By learning about these key measurement tools, you can interpret the results, make informed decisions, and fine-tune your application to achieve optimal outcomes.
To learn more, see Built in evaluators.
Troubleshooting
| Symptom | Possible cause | Action |
|---|
| Run stays pending | High service load or queued jobs | Refresh, verify quota, and resubmit if prolonged |
| Metrics missing | Not selected at creation | Rerun and select required metrics |
| All safety metrics zero | Category disabled or unsupported model | Confirm model and evaluator support in Risk and safety evaluators |
| Groundedness unexpectedly low | Retrieval/context incomplete | Verify context construction / retrieval latency |
Related content