langchain-azure-ai integration package to emit OpenTelemetry traces from LangChain and
LangGraph applications and sink them in Azure Application Insights. In this article, you configure
AzureAIOpenTelemetryTracer, attach it to your runnable, and inspect traces in
Azure Monitor.
The tracer emits spans for agent execution, model calls, tool execution, and
retrieval operations. You can use it for apps that run fully local, hybrid
flows that call Foundry Agent Service, or multi-agent LangGraph solutions.
Prerequisites
- An Azure subscription. Create one for free.
- A Foundry project.
- A deployed Azure OpenAI chat model (for example,
gpt-4.1). - Python 3.10 or later.
- Azure CLI signed in (
az login) soDefaultAzureCredentialcan authenticate.
Configure your environment
Install required packages:enable_content_recording to the AzureAIOpenTelemetryTracer constructor.
Content recording is enabled by default.
Create the tracer
Create one tracer instance and reuse it across your workflow.agent_id parameter to set the attribute
gen_ai.agent.id when invoking agents. The name parameter sets the
OpenTelemetry tracer name.
The tracer supports common controls for production workflows:
- Pass
connection_stringto target a specific Application Insights resource or by configuring the environment variableAPPLICATION_INSIGHTS_CONNECTION_STRING. - Set
trace_all_langgraph_nodes=Trueto trace all nodes by default. - Use node metadata like
otel_trace: Trueorotel_trace: Falseto include or skip specific nodes. - Use
message_keysandmessage_pathswhen your messages are nested under a custom state shape, for examplechat_history.
Trace an agent
Start with a minimal LangChain agent so you can verify tracing quickly. For LangGraph, attach the tracer withwith_config on the compiled graph.
Trace a LangChain runnable
Start with a minimal LangChain flow so you can verify tracing quickly.AzureAIOpenTelemetryTracer.
Reference:
Trace a LangGraph graph
For LangGraph, attach the tracer withwith_config on the compiled graph.
This snippet reuses model and tracer from earlier examples.
invoke_agent and model/tool spans into the same trace.
Reference:
Understand trace structure
The tracer emits spans that follow the OpenTelemetry GenAI semantic conventions. Each span type uses a specificgen_ai.operation.name value:
Spans also carry these key attributes:
gen_ai.agent.name— The agent or node name.gen_ai.agent.id— Set from theagent_idconstructor parameter.gen_ai.agent.description— A description of the agent.gen_ai.provider.name— The model provider (for example,openai).gen_ai.request.model— The model name used for inference.gen_ai.conversation.id— Thread or session identifier, when available.gen_ai.usage.input_tokens/gen_ai.usage.output_tokens— Token counts from model responses.gen_ai.input.messages/gen_ai.output.messages— Message content (when content recording is enabled).
How the tracer resolves gen_ai.agent.name
The tracer resolves the agent name from the first non-empty value in this order:
agent_namein the node metadata.langgraph_nodein the node metadata (set automatically by LangGraph).agent_typein the node metadata.- The
namekeyword argument from the LangChain callback. langgraph_path(last element) if the above are generic placeholders.- The serialized chain ID or class name.
- The
nameparameter from theAzureAIOpenTelemetryTracerconstructor (fallback default).
How the tracer resolves gen_ai.agent.id
The tracer resolves the agent ID from:
agent_idin the node metadata (per-node override).- The
agent_idconstructor parameter (default for all spans).
Customize attributes with node metadata
You can setagent_name, agent_id, and agent_description per node using
LangGraph metadata. Any metadata key starting with gen_ai. is also forwarded
as a span attribute.
View traces in Azure Monitor
Traces are sent to Azure Application Insights and can be queried using Azure Monitor:- Go to the Azure portal.
- Navigate to the Azure Application Insights you configured.
- Using the left navigation bar, select Investigate > Agents (Preview).
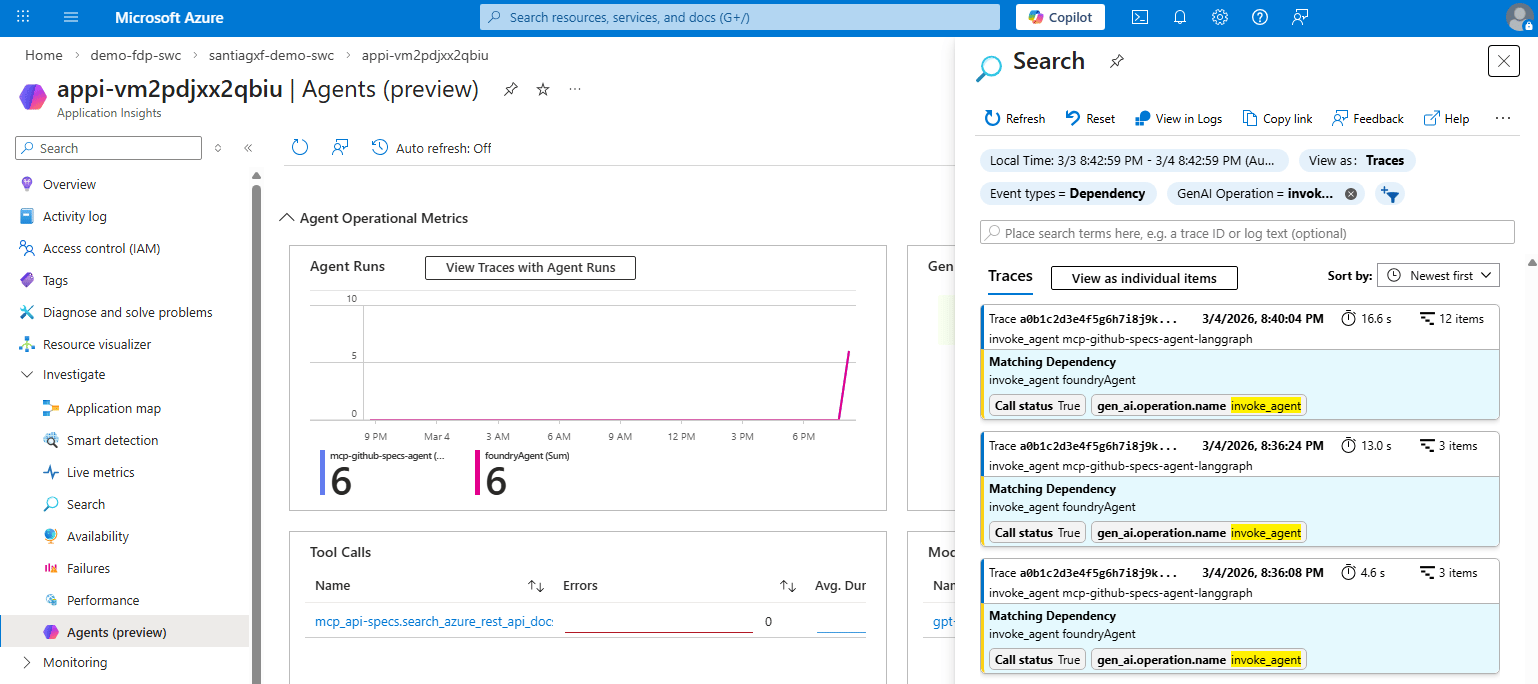
- You see a dashboard showing agent, model, and tool executions. Use this view to understand the overall activity of your agents.
- Select View Traces with Agent Runs. The side panel shows all the traces generated by agent runs.
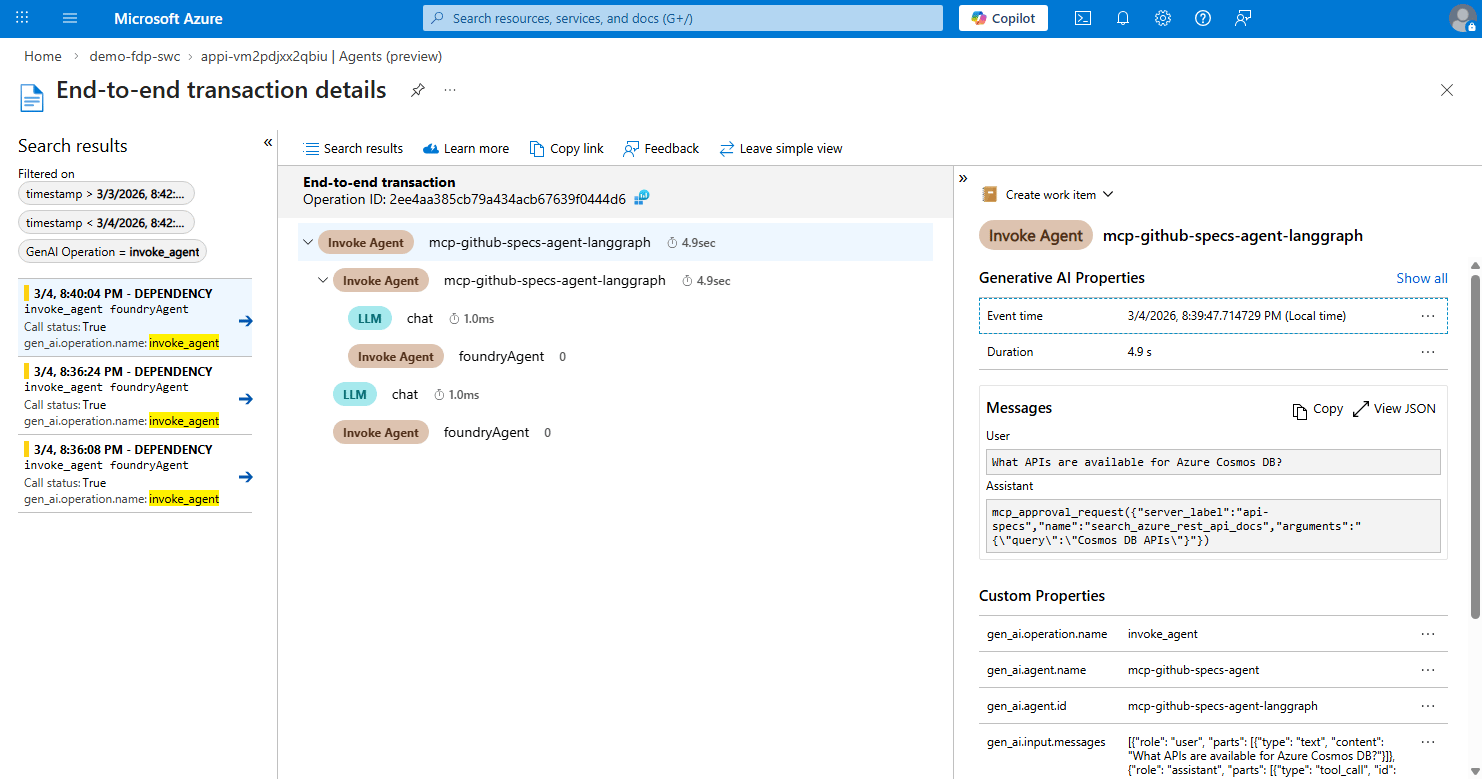
- Select one of the traces. You should see the details.
View traces in Foundry Control Plane
If you deployed your LangGraph or LangChain solution, you can register that deployment into Foundry Control Plane to gain visibility and governance. Register your application into Foundry Control Plane to view traces in the Foundry portal. Follow these steps:-
Ensure that you meet the requirements to use the Foundry Control Plane custom agent capability:
- An AI gateway configured in your Foundry resource. Foundry uses Azure API Management to register agents as APIs.
- An agent that you deploy and expose through a reachable endpoint. The endpoint can be either a public endpoint or an endpoint that’s reachable from the network where you deploy the Foundry resource.
- Ensure that you have observability configured in the project.
-
When configuring the class
AzureAIOpenTelemetryTracer, make sure to use the project’s endpoint you want the agent to be registered at. Ensure you configureagent_id. - Go to the Foundry portal.
- On the toolbar, select Operate.
- On the Overview pane, select Register agent.
-
The registration wizard appears. First, complete the details about the agent that you want to register.
- Agent URL: The endpoint (URL) where your agent runs and receives requests.
- Protocol: The communication protocol that your agent supports.
- OpenTelemetry Agent ID: The
agent_idparameter that you configured in theAzureAIOpenTelemetryTracerclass. - Project: The project that you configured to receive traces in the
AzureAIOpenTelemetryTracerclass. - Agent name: The name of the agent (it can be the same as
agent_id).
- Invoke the agent to make sure it has runs.
- On the toolbar, select Operate.
- On the left pane, select Assets.
- Select the agent you created.
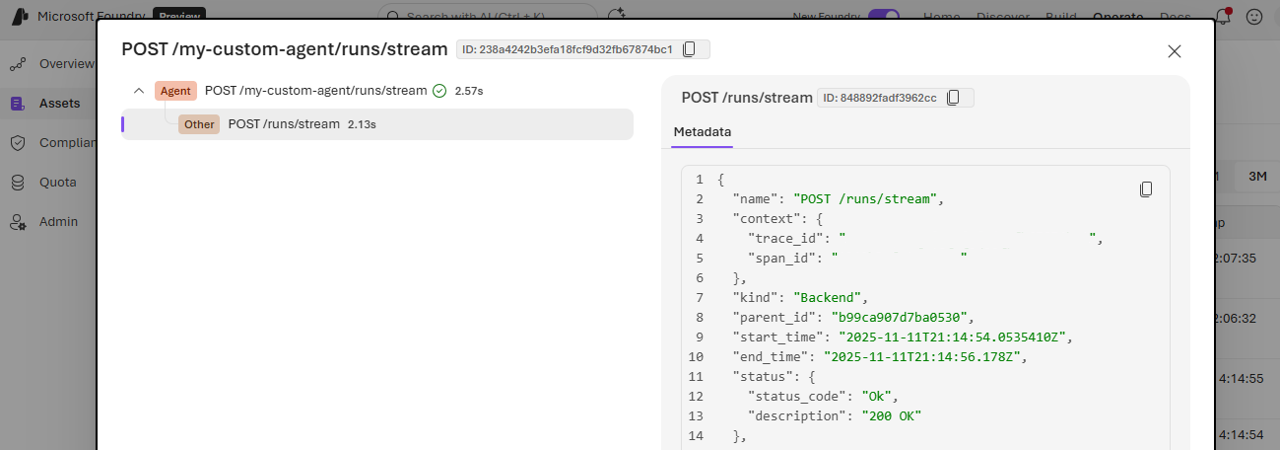
- The Traces section shows one entry for each HTTP call made to the agent’s endpoint. To see the details, select an entry.
Troubleshoot
- If no traces appear, verify that either
connection_stringis configured or your project endpoint exposes telemetry. - If message content appears redacted, set
enable_content_recording=Truein theAzureAIOpenTelemetryTracerconstructor. - If some LangGraph nodes are missing, set
trace_all_langgraph_nodes=Trueor add node metadataotel_trace: True.