Items marked preview in this article are currently in preview. This preview is provided without a service-level agreement, and Microsoft doesn’t recommend it for production workloads. Certain features might not be supported or might have constrained capabilities. For more information, see Supplemental Terms of Use for Microsoft Azure Previews.
Tracing is generally available for prompt and hosted agents. Workflow and external agents are in preview.
Prerequisites
- A Foundry project.
- An Azure Monitor Application Insights resource to store traces (create a new one or connect an existing one).
- Access to the Application Insights resource connected to your project.
- The Log Analytics Reader role on the connected Application Insights resource (required to query telemetry). If the underlying Log Analytics tables are protected, also assign the Privileged Monitoring Data Reader role.
Connect Application Insights to your Foundry project
Foundry stores traces in Application Insights by using OpenTelemetry semantic conventions.- Sign in to Microsoft Foundry. Make sure the New Foundry toggle is on. These steps refer to Foundry (new).

- Open your Foundry project.
- In the left navigation, select Agents.
- At the top, select Traces.
- On the right, select Connect to create or connect an Application Insights resource.

- To connect an existing resource, select the resource, and then select Connect.
- To create a new resource, select Create new, and then complete the wizard.
Use the project details connection path
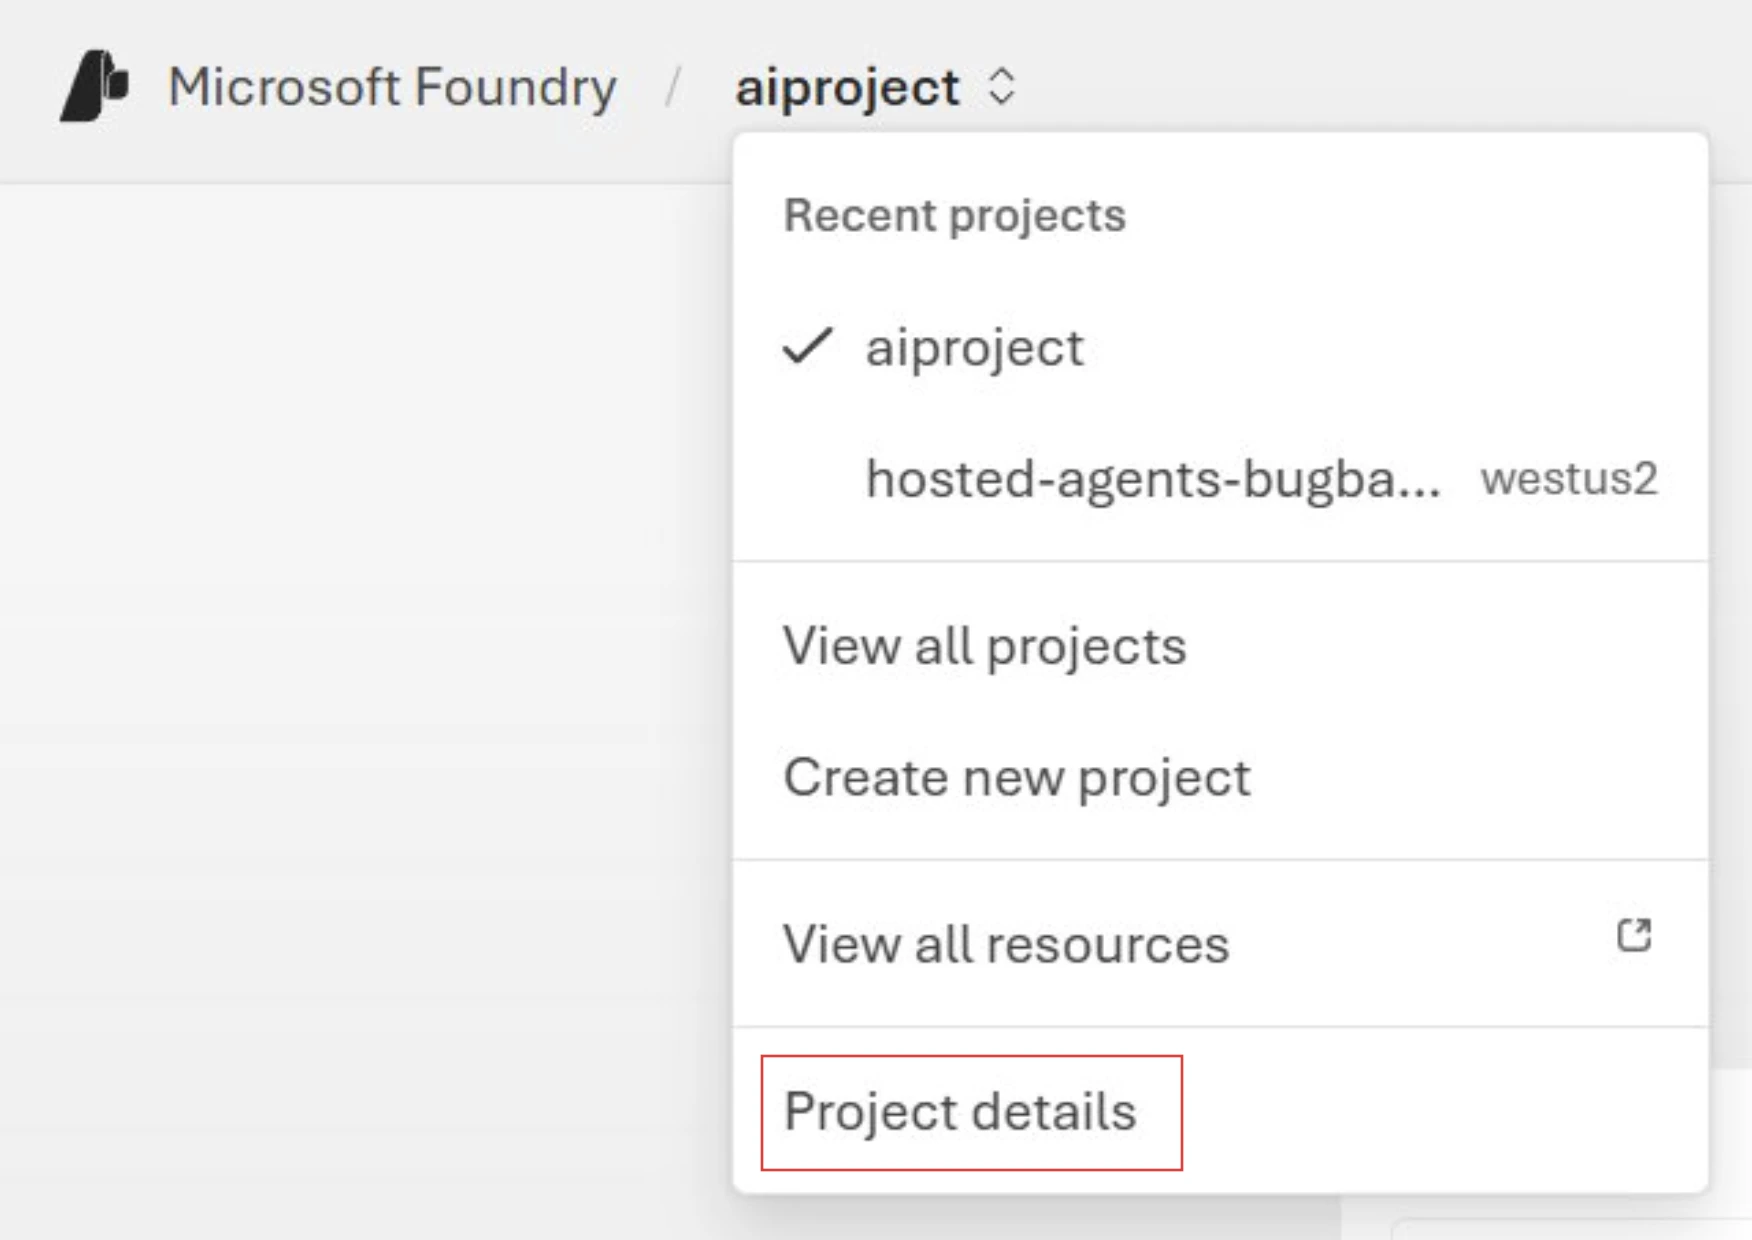
If you don’t see the message bar or Connect button, use this alternative way to enable Azure Monitor Application Insights.- Select Manage in the upper-right navigation, and then select Project details.
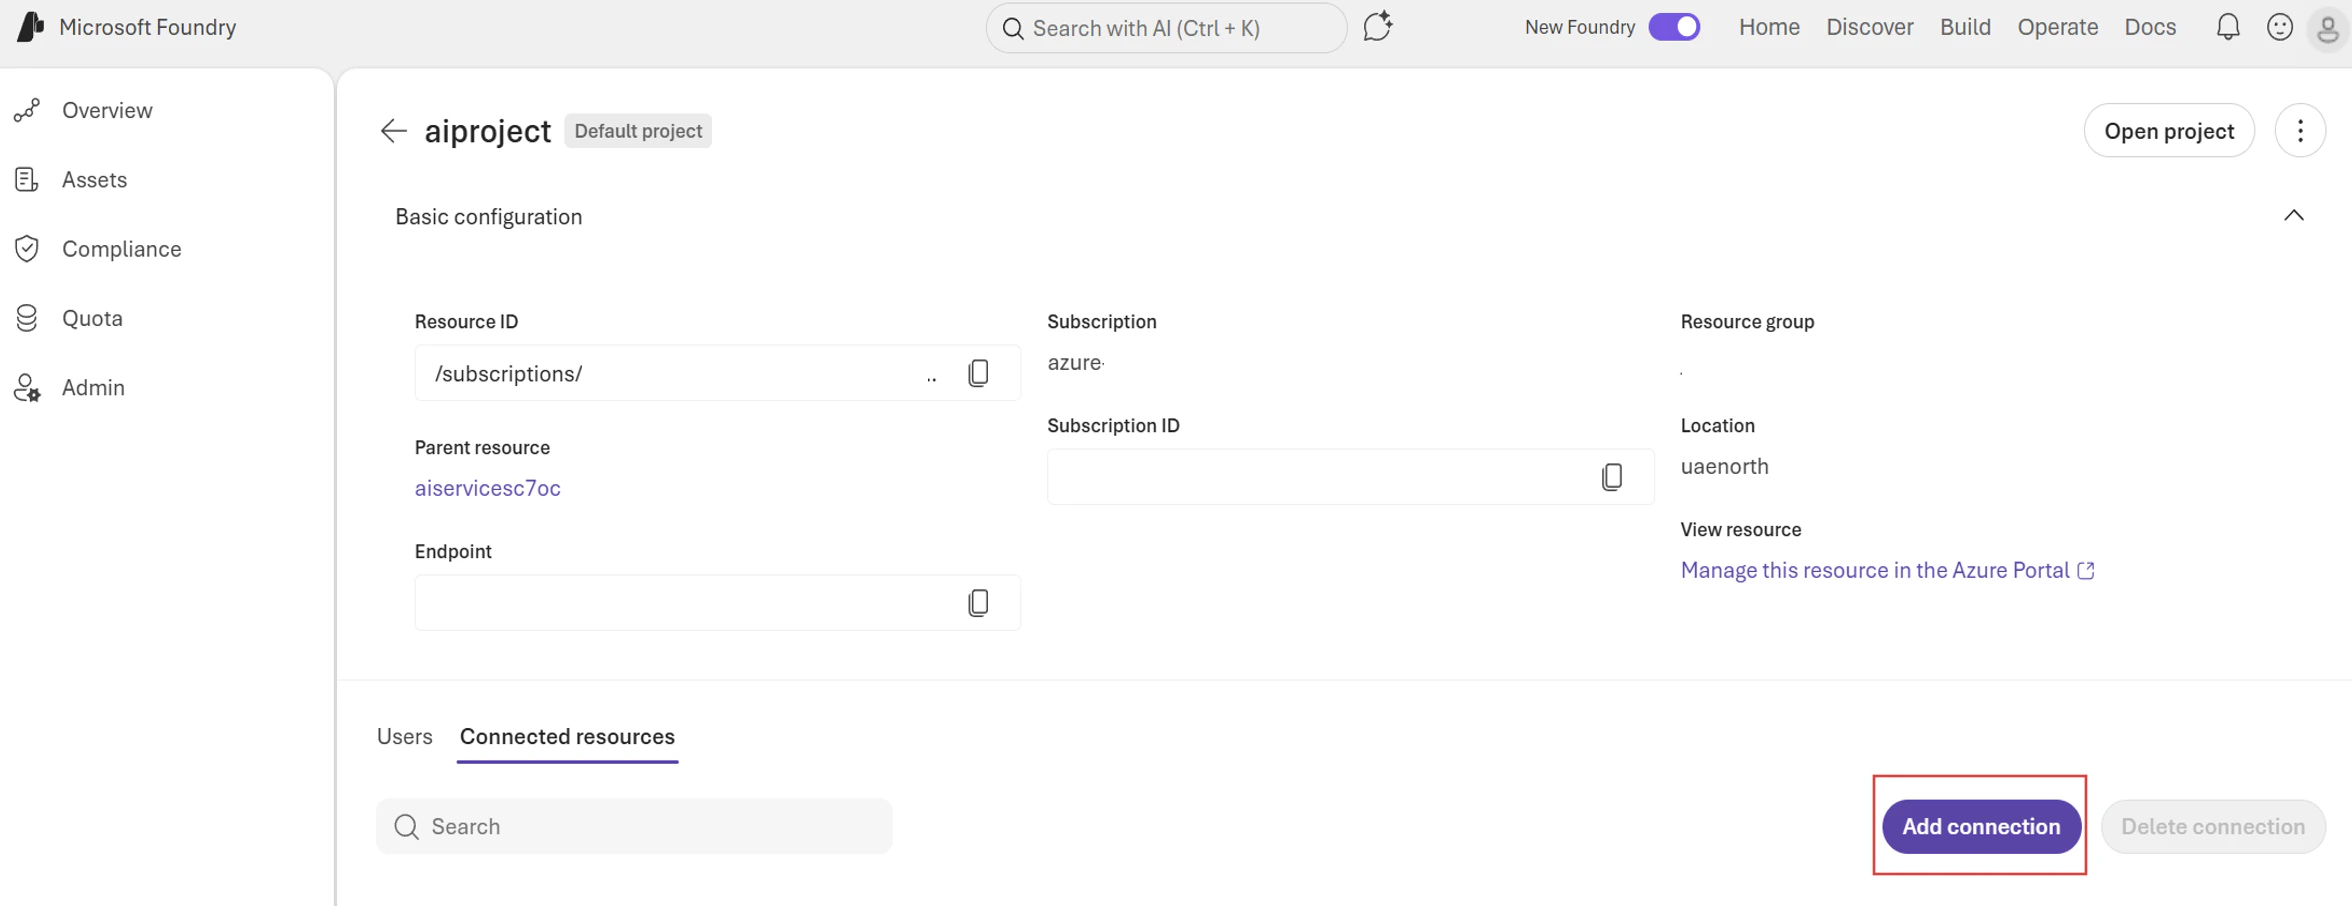
- Select the Connected resources tab, and then select Add connection.
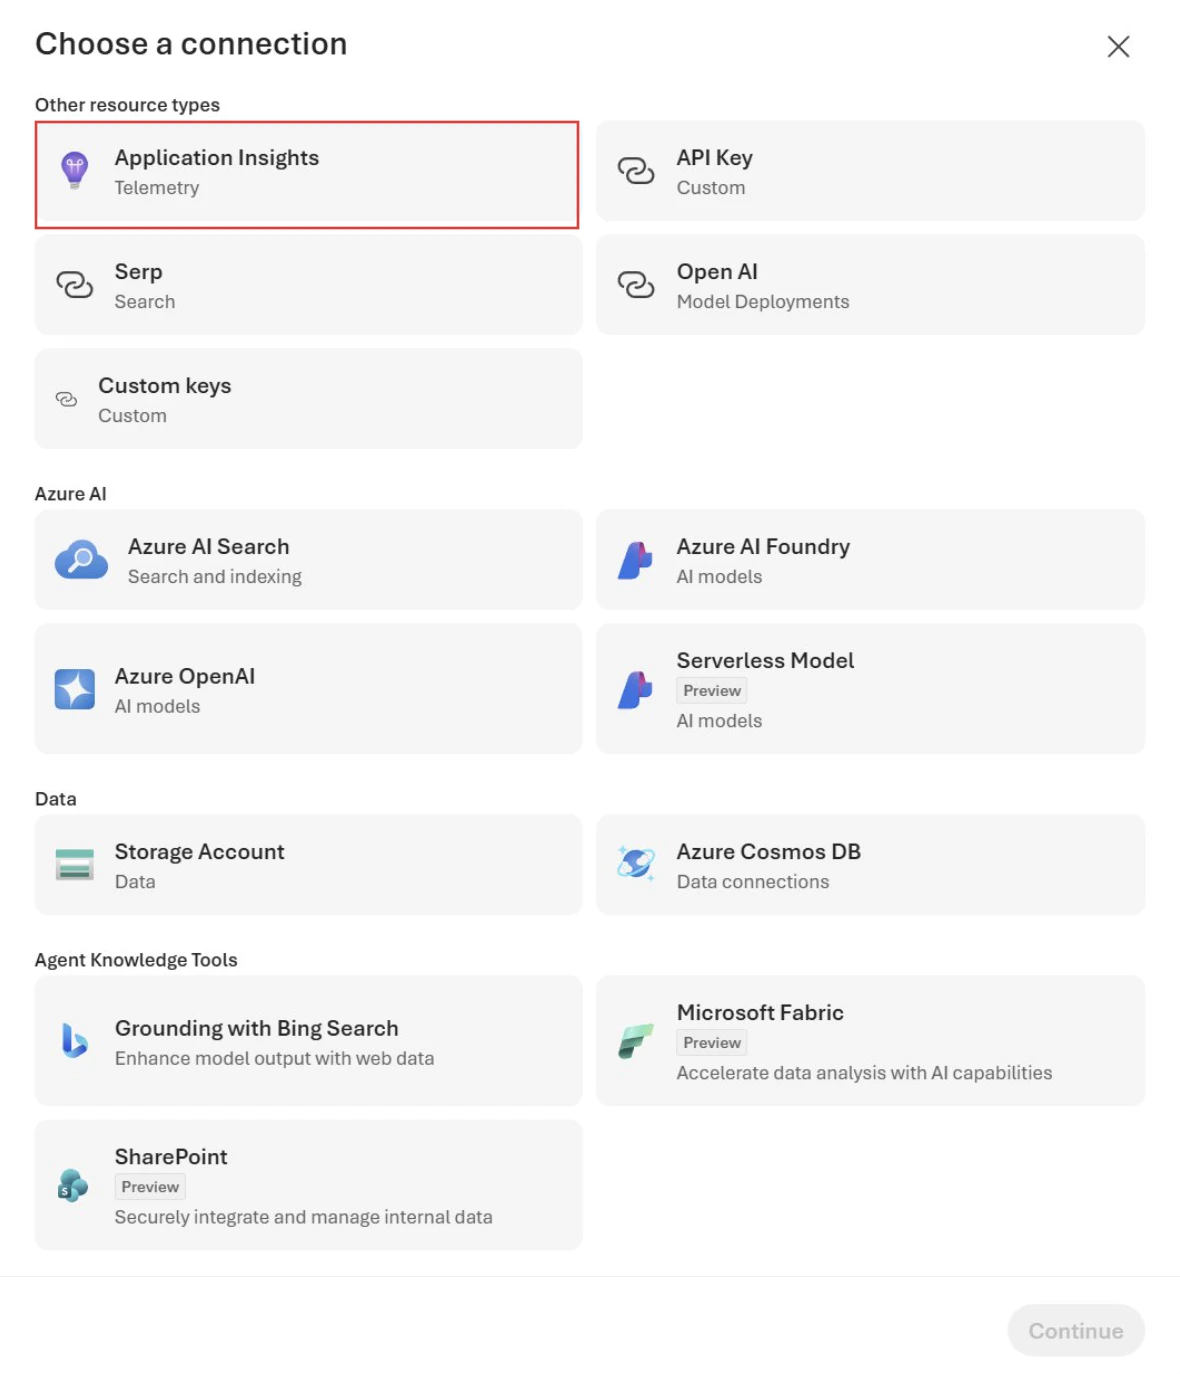
- In Choose a connection, select Application Insights.
Make sure you have the permissions you need to query telemetry.
- For log-based queries, start by assigning the Log Analytics Reader role. If the underlying Log Analytics tables are protected, also assign the Privileged Monitoring Data Reader role.
- To learn how to assign roles, see Assign Azure roles using the Azure portal.
- To manage access at scale, use Microsoft Entra groups.
Instrument AI agents
Choose the approach that matches how you build and run your agent.Server-side traces in the Foundry portal
Start with server-side traces. Foundry logs traces for common agent and workflow scenarios without changing your code.- Foundry automatically logs server-side traces for Prompt agents, Host agents, and workflows in the Foundry portal. After tracing is enabled in your Foundry project, you have access to out-of-the-box traces for the past 90 days.
- Foundry also supports easy integration with top agent frameworks.
Client-side traces with the Microsoft Foundry SDK
Install OpenTelemetry and the Azure SDK tracing plugin by using the following steps:- Python
- C#
To use a project’s endpoint in your application, you need to configure Microsoft Entra ID. If you don’t configure Microsoft Entra ID, use the Application Insights connection string.
Trace locally with the Microsoft Foundry Toolkit for Visual Studio Code extension
The Microsoft Foundry Toolkit for Visual Studio Code extension lets you trace locally in VS Code by using a local OTLP-compatible collector. This approach is ideal for development and debugging. The toolkit supports AI frameworks such as Foundry Agent Service, OpenAI, Anthropic, and LangChain through OpenTelemetry. You can see traces instantly in VS Code without needing cloud access. For detailed setup instructions and SDK-specific code examples, see Tracing in Foundry Toolkit.View and analyze traces
View traces in the Foundry portal
In your Foundry project, go to the Traces tab in your agents or workflows. You can search, filter, or sort ingested traces from the last 90 days. Select a trace to step through each span, identify problems, and observe how your application responds. This process helps you debug and pinpoint problems in your application.View traces in Azure Monitor
Your traces are sent to Azure Monitor Application Insights, so you can view them there. For more information on how to send traces to Azure Monitor and create an Azure Monitor resource, see Azure Monitor OpenTelemetry documentation.View conversation results
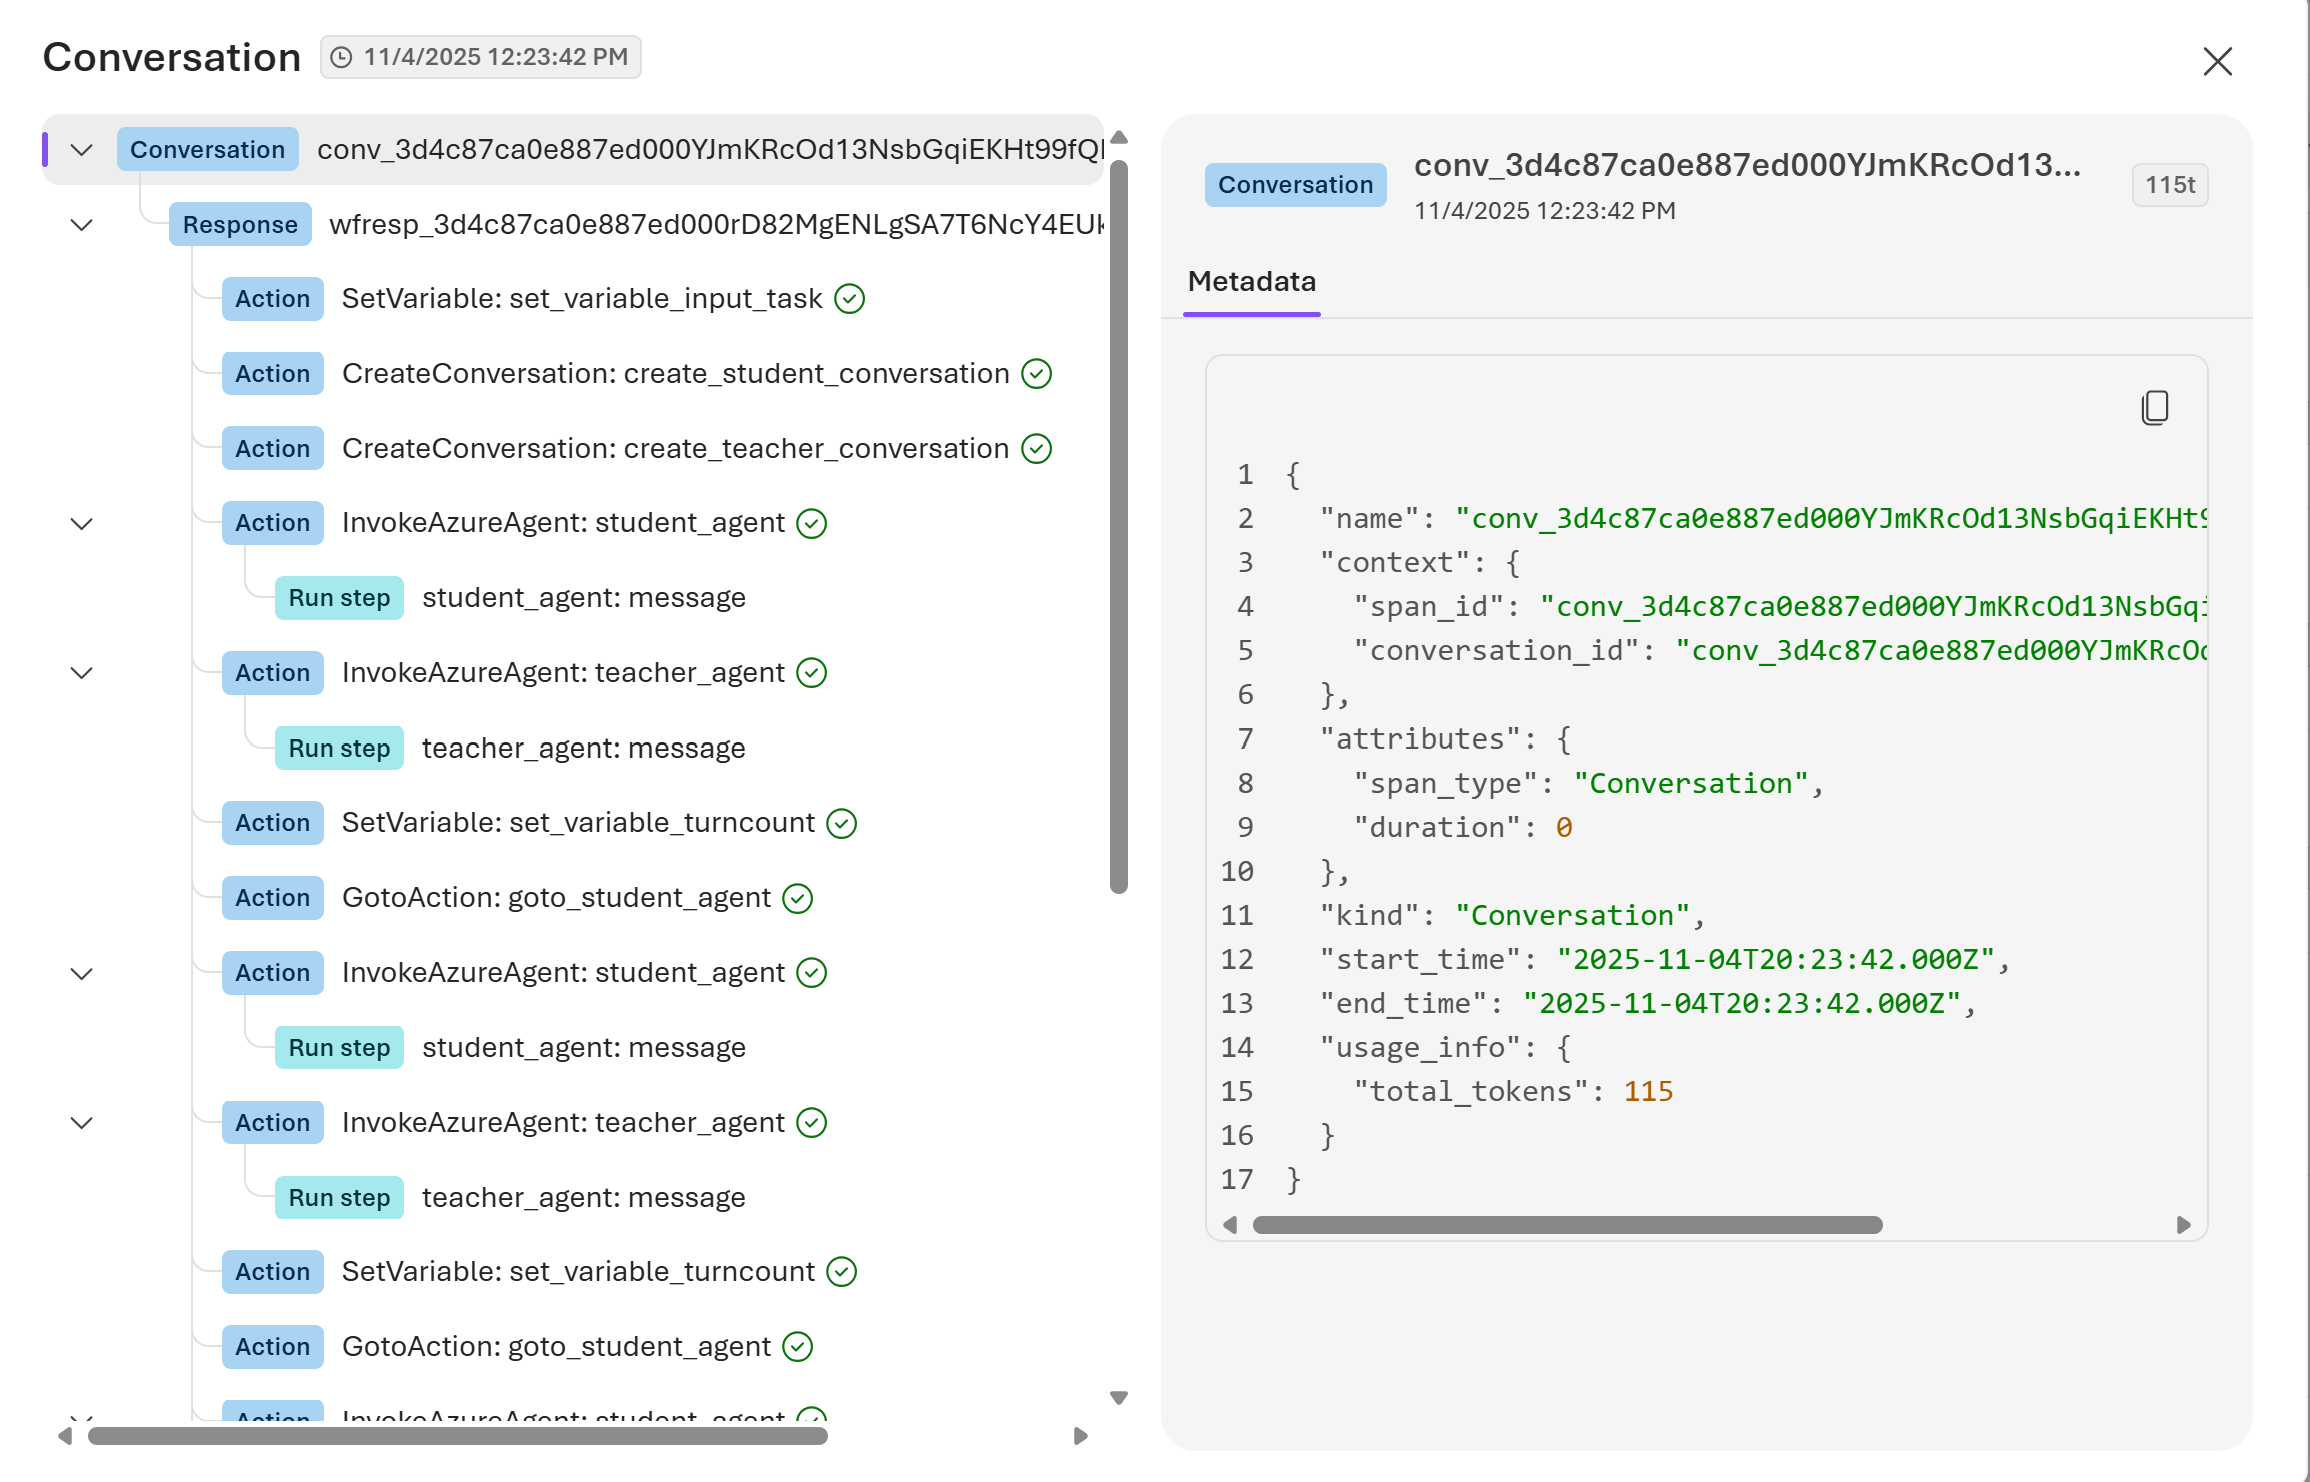
A Conversation is the persistent context of an end-to-end dialogue history between a user and an agent. In the Foundry portal, you can view Conversation results for your agent run out of the box along with traces on the Traces page. Search by Response ID or by a Trace ID that maps to this conversation. Then select a Conversation ID to review:- Conversation history details
- Response information and tokens in a run
- Ordered actions, run steps, and tool calls
- Inputs and outputs between a user and an agent
Verify tracing works
- Confirm your project is connected to Application Insights. If needed, follow the steps in Connect Application Insights to your Foundry project.
- Run your agent or workflow at least once (for example, by using the portal or your app).
- In your Foundry project, open the Traces view and confirm a new trace appears. When tracing is working correctly, you see a list of recent traces with timestamps, durations, and status indicators. Select a trace to view its span details.
Security and privacy
Tracing can capture sensitive information, such as user inputs, model outputs, and tool arguments and results. Use these practices to reduce risk:- Don’t store secrets, credentials, or tokens in prompts, tool arguments, or span attributes.
- Redact or minimize personal data and other sensitive content before it appears in telemetry.
- Treat trace data as production telemetry and apply the same access controls and retention policies you use for logs and metrics.