- Locate and open evaluation runs.
- View aggregate and sample-level metrics.
- Compare results across runs.
- Interpret metric categories and calculations.
- Troubleshoot missing or partial metrics.
Prerequisites
- Foundry User role on the Foundry project. For more information, see Role-based access control for Microsoft Foundry.
The Foundry RBAC roles were recently renamed. Foundry User, Foundry Owner, Foundry Account Owner, and Foundry Project Manager were previously named Azure AI User, Azure AI Owner, Azure AI Account Owner, and Azure AI Project Manager. You might still see the previous names in some places while the rename rolls out. The role IDs and core permissions are unchanged by the rename.
- For all evaluation role requirements, see Set up permissions for evaluation workflows.
- A completed evaluation run.
- To run evaluations in the portal, see Evaluate generative AI models and applications.
- To run evaluations from the SDK, see Run evaluations from the SDK or Evaluate your AI agents.
See your evaluation results
- In the Foundry portal, go to your project and select Evaluation from the left pane.
-
Select an evaluation run from the list to open its details page. If the run is still in progress, the status shows Running and updates automatically when complete.
The details page shows:
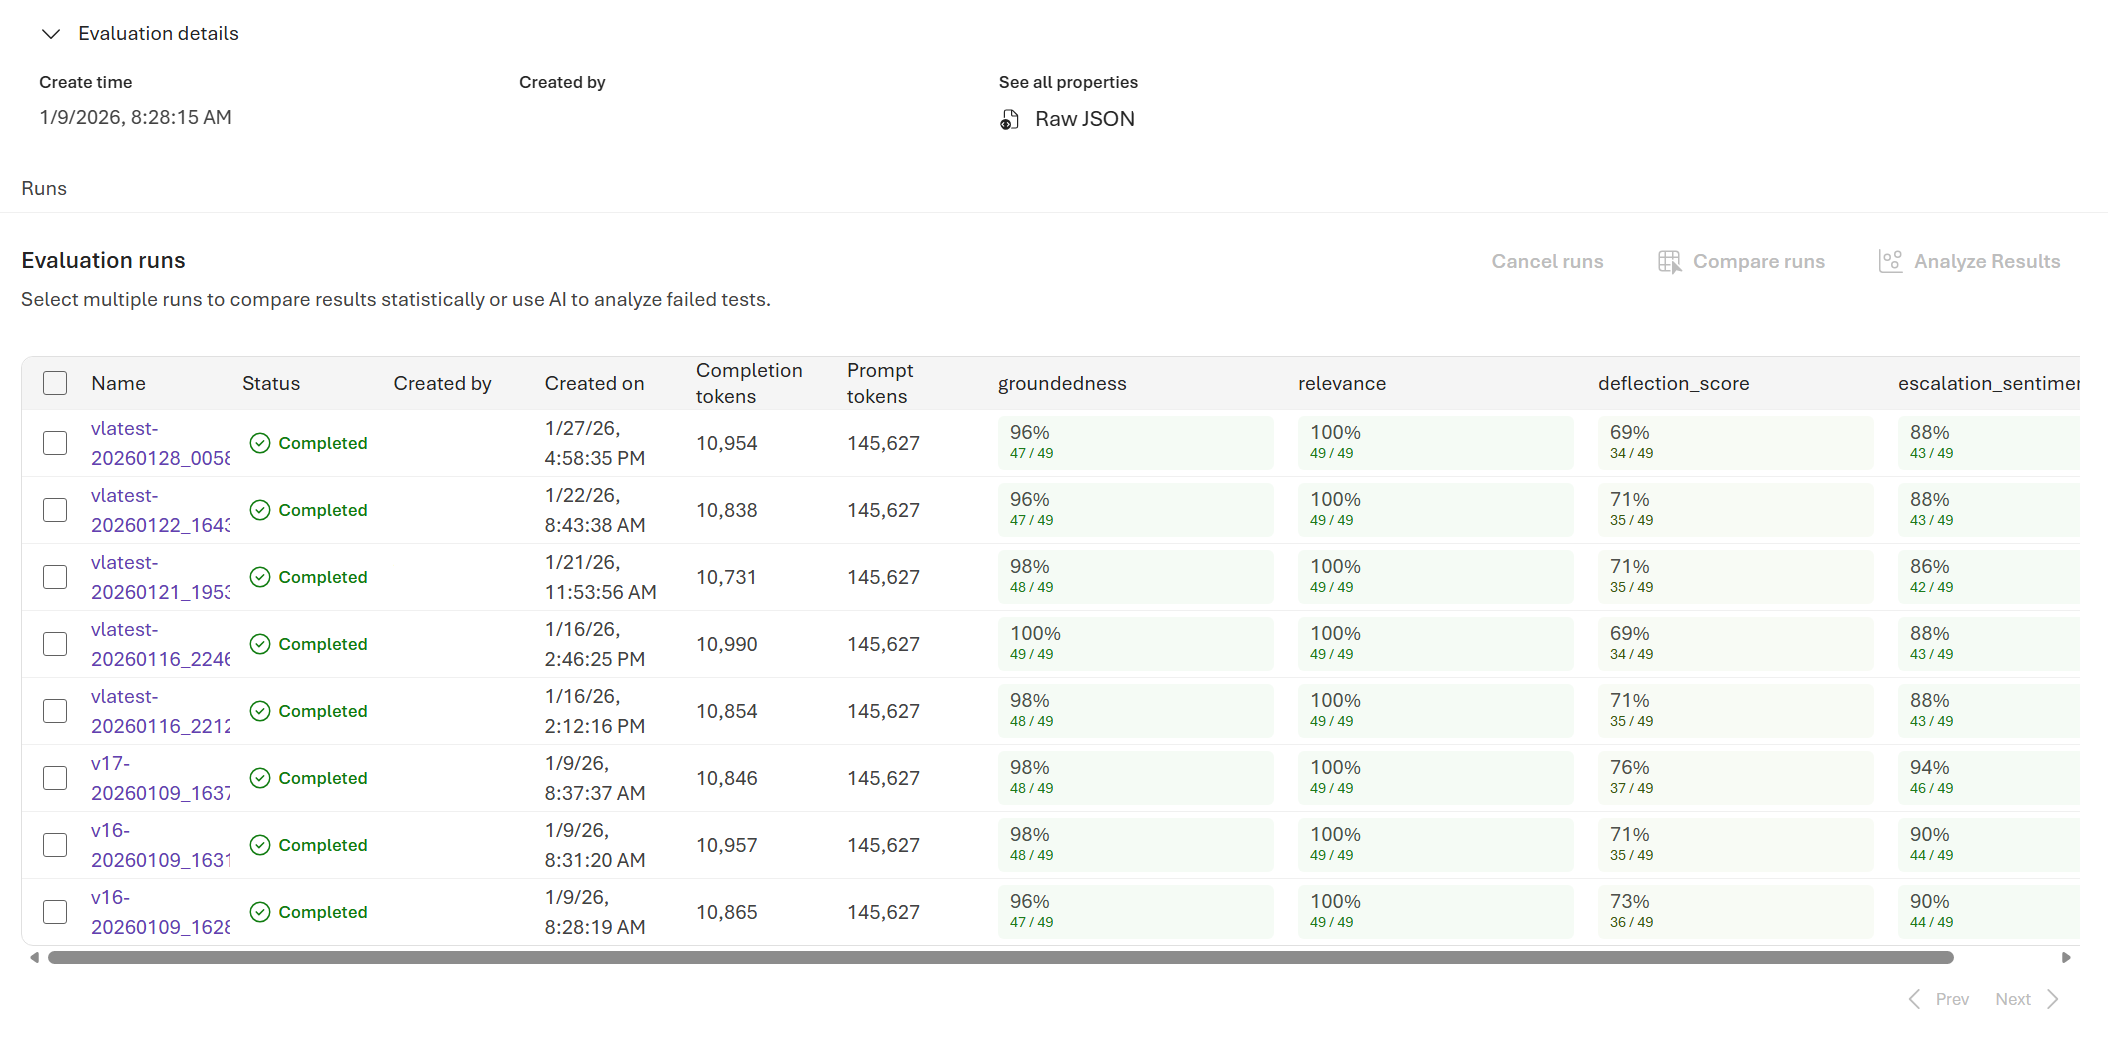
- Hover over a score cell to see token usage details and additional context.

- Select Learn more about metrics to see metric definitions and scoring formulas.
Evaluation run details
Select the name of the run to view row-level results for each individual query. For each row, you can see the query, response, ground truth, evaluator score, and score explanation.Review model-target latency and estimated cost
For model-target evaluation runs, the run details can include target latency and estimated target inference cost. The latency summary reports median (p50) and 95th-percentile (p95) end-to-end target latency in milliseconds, along with the number of rows that contributed a usable measurement. The cost estimate is currently available for Global Standard model deployments when the run has usable target token attribution and pricing data. If some attributed models can’t be priced, the result is marked partial and the estimate includes only the models with available prices.Target cost is an estimate based on reported token usage and published list
prices. It excludes evaluator model usage and evaluation runtime costs, and it
doesn’t account for negotiated pricing, commitments, or discounts. Use Azure
billing data for actual charges.
Compare the evaluation results
To compare two or more runs, select the runs you want to compare and start the process.- Select two or more runs in the evaluation detail page.
- Select Compare.
- Baseline comparison: By setting a baseline run, you can identify a reference point against which to compare the other runs. You can see how each run deviates from your chosen standard.
- Statistical t-testing assessment: Each cell provides the stat-sig results with different color codes. You can also hover on the cell to get the sample size and p-value.
The comparison view isn’t saved. If you leave the page, you can reselect the runs and select Compare to regenerate the view.