Tracing is currently in preview.
azure-ai-agentserver-responses and azure-ai-agentserver-invocations) smoothly integrate the Microsoft OpenTelemetry distro, which provides out-of-the-box instrumentation for Microsoft Agent Framework and LangChain, and exports traces to Application Insights. In addition, Foundry Agent Service emits server-side telemetry for agent invocation automatically—no code changes required.
Tracing gives you visibility into how your agent handles each request so you can debug issues, monitor latency, and understand agent behavior before releasing changes to users.
Prerequisites
Before you begin, you need:-
A deployed, invokable hosted agent from Deploy your first hosted agent, and the
azdproject directory you created in that quickstart. - The Foundry User role on the Foundry resource.
- To use the UI path, access to the Foundry portal. For the azd path, see the next requirements.
-
Azure Developer CLI (azd) 1.27.1 or later with the
azd microsoft.foundryextension: -
An authenticated
azdsession. Check your status withazd auth status, and runazd auth loginif you’re not signed in.
The Foundry RBAC roles were recently renamed. Foundry User, Foundry Owner, Foundry Account Owner, and Foundry Project Manager were previously named Azure AI User, Azure AI Owner, Azure AI Account Owner, and Azure AI Project Manager. You might still see the previous names in some places while the rename rolls out. The role IDs and core permissions are unchanged by the rename.
- An Azure Monitor Application Insights resource connected to your Foundry project. To set it up, see Set up tracing in Microsoft Foundry.
- The Log Analytics Reader role on the Application Insights resource connected to your project. If the underlying Log Analytics tables are protected, also assign the Privileged Monitoring Data Reader role.
Step 1: Invoke your agent
Generate trace data by sending a request to your deployed agent.- Azure Developer CLI
- Foundry portal
From your You should see a response within a few seconds.
azd project directory, send a test prompt:Step 2: View traces in the Foundry portal
Traces can be viewed in the Foundry portal after invocation.- In the Foundry portal, open your project.
- In the left navigation, select Agents.
- At the top, select Traces.
- Find your trace in the list. You can search by Trace ID, Response ID, or filter by time range.
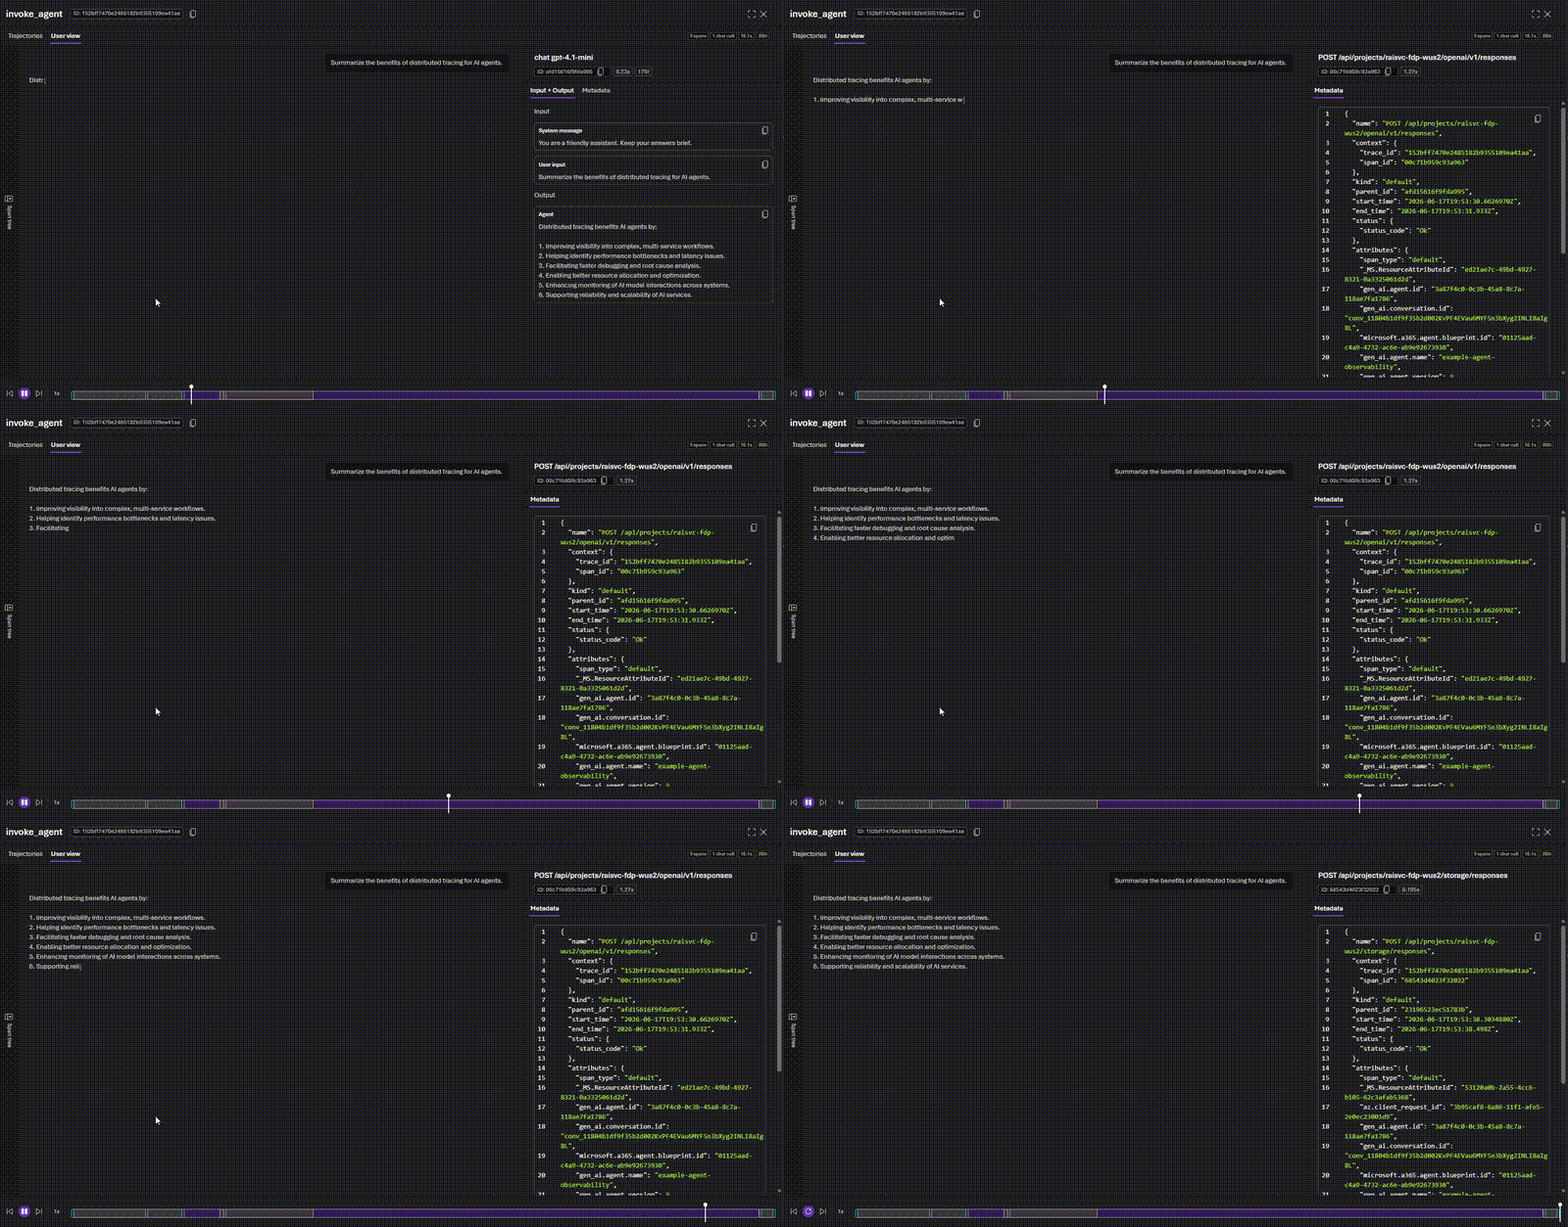
Trajectory

User view
Clean up resources
Tracing data is stored in Application Insights and follows your workspace’s data retention settings. This quickstart doesn’t create any extra resources. To clean up the previous quickstart, runazd down from your agent project directory. What the command deletes depends on whether initialization created or reused the Foundry project.
Troubleshooting
What you learned
In this quickstart, you:- Learned that hosting libraries integrate the Microsoft OpenTelemetry distro for out-of-the-box instrumentation.
- Invoked your deployed agent to generate trace data.
- Viewed end-to-end traces in the Foundry portal.
Next steps
Set up tracing in Microsoft Foundry
- Set up tracing in Microsoft Foundry for detailed tracing configuration.
- Configure tracing for AI agent frameworks to instrument LangChain and other frameworks.
- Monitor AI agents with the Agent Monitoring Dashboard for production monitoring.